Last updated March 18, 2026
A Heroku app’s logs come from the output streams of all of its running processes, system components, and backing services. Heroku’s logging infrastructure routes log streams from all sources into a single channel, providing a foundation for comprehensive logging.
Runtime Logs
Heroku aggregates the following categories of logs for a deployed app:
- App logs - Logging output from the application itself, including logs generated by your app’s code and dependencies. (Filter:
--source app) - System logs - Messages about actions taken by the Heroku platform infrastructure on behalf of your app, such as: restarting a crashed process, sleeping or waking a web dyno, or serving an error page due to a problem in your app. (Filter:
--source heroku). For the Fir-generation of our platform, all internal Heroku telemetry is prefixed withheroku-. Examples areheroku-router,heroku-runtimeandheroku-api. - API logs - Messages about administrative actions taken by you and other developers working on your app, such as: deploying new code, scaling the process formation, creating a new log session or toggling maintenance mode. (Filter:
--source app --dyno api) - Add-on logs - Messages from add-on services. See the add-on’s Dev Center article for details. (Filter varies by add-on)
Build Logs
The logs generated while building and deploying your app are separate from the app’s runtime logs. Logs for both successful and unsuccessful builds are available from your app’s Activity tab in the Heroku Dashboard:
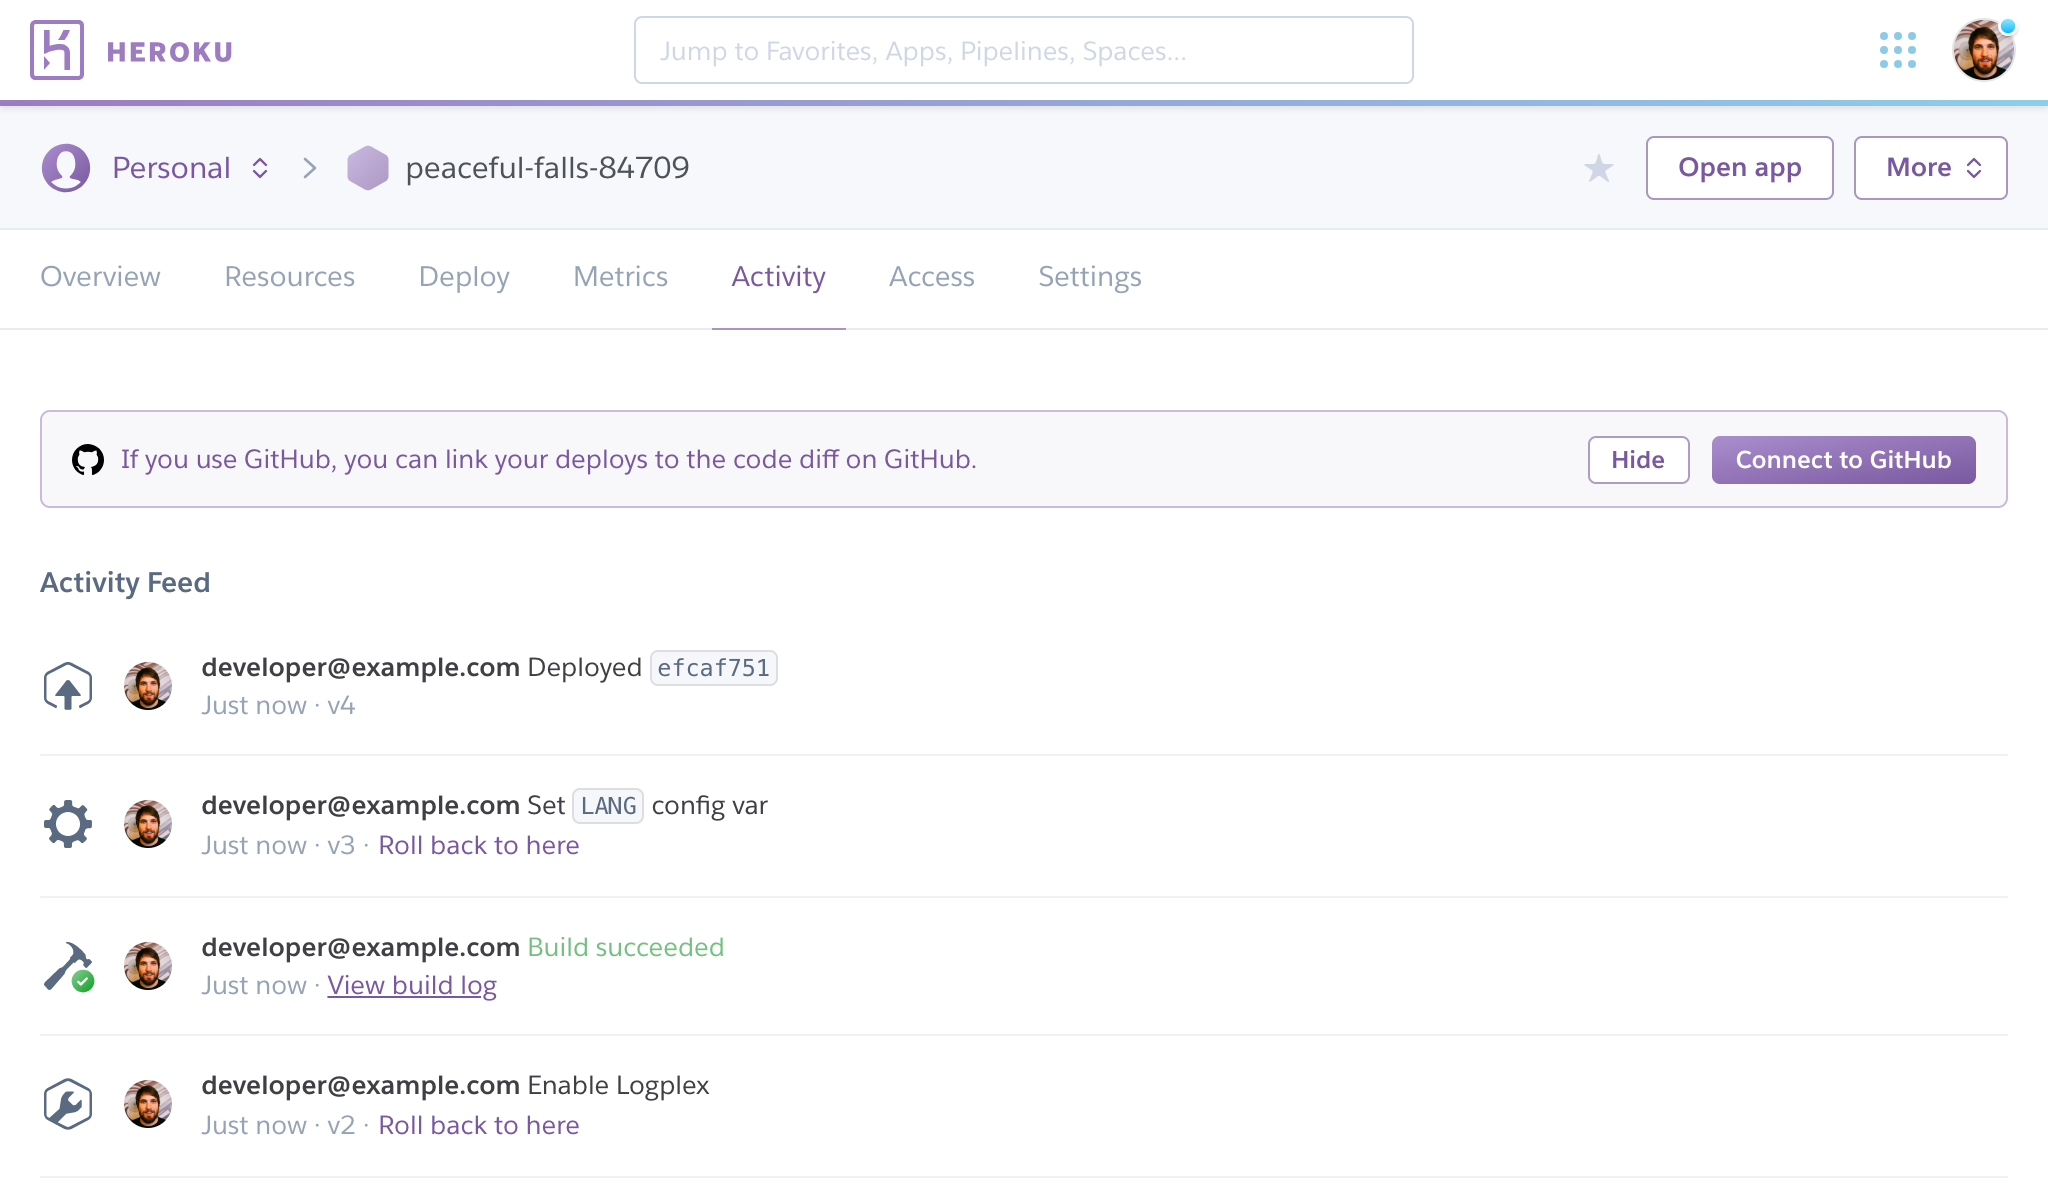
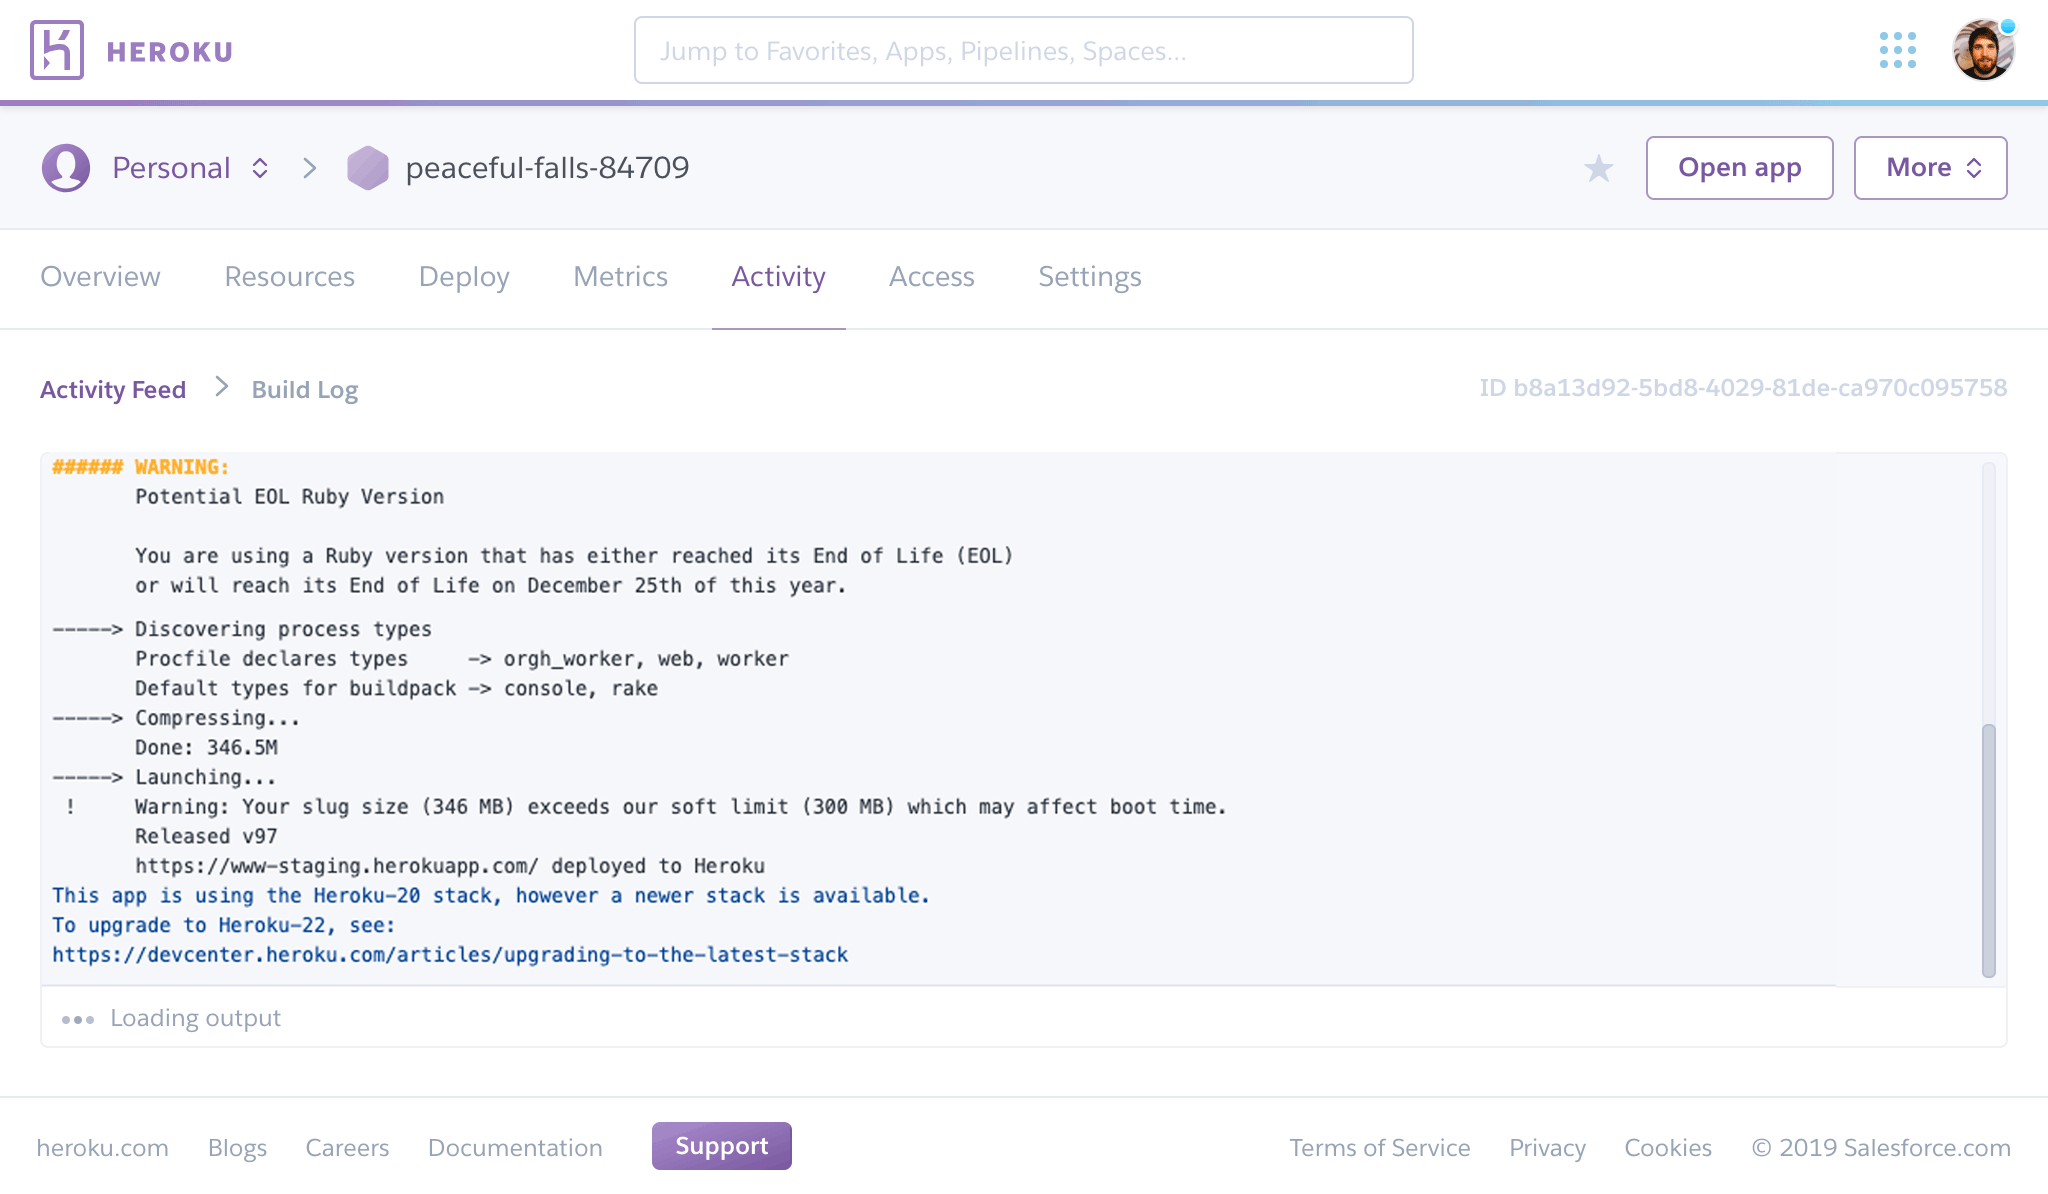
Click View build log for any build event in the Activity Feed to see its logs:
Log History Limits
Log History Limits on Cedar
Cedar-generation apps, except ones in Shield Spaces with Private Space Logging enabled use Logplex, which is designed for collating and routing log messages, not for storage. It retains the most recent 1,500 lines of your consolidated logs that after 1 week.
For more production-ready persistence of logs, add one of the Heroku platform’s available logging add-ons to your app. Most of these add-ons offer a free plan to get started.
Alternatively, implement your own log drains for full control over what happens to your logs.
Shield spaces with Private Space Logging enabled can’t use the heroku logs command and there is no log history. See Private Space Logging for more info.
Log History Limits on Fir
The Fir of Heroku’s platform doesn’t use Logplex, but instead uses OpenTelemetry signals to export OTLP logs. See Heroku Telemetry for more info. Similar to Logplex, this is designed for collating and routing log messages, not for storage. Additionally, there is no log history.
For more production-ready persistence, add a telemetry drain to your app for a provider that supports an OpenTelemetry OTLP logging backend.
Writing to Your Log
Your logs capture anything your app writes to standard out (stdout) or standard error (stderr). You can log from anywhere in your application code with a simple output statement.
In the Common Runtime, we expand the values of the config vars referenced in your code commands before sending the output to your logs for audit purposes. Avoid using direct references to sensitive environment variables where your app code writes to standard out (stdout) or standard error (stderr).
In Ruby, you could use something like:
puts "Hello, logs!"
In Java:
System.err.println("Hello, logs!");
System.out.println("Hello, logs!");
The same holds true for all other languages supported by Heroku.
To take advantage of real-time logging, disable any log buffering your application performs. For example, in Ruby, add the following code to your config.ru file:
$stdout.sync = true
Some frameworks send log output somewhere other than stdout by default and require extra configuration. For example, when using the Ruby on Rails TaggedLogger by ActiveSupport, add the following into your app’s configuration to get stdout logging:
config.logger = Logger.new(STDOUT)
See Writing Best Practices For Application Logs for more info.
Emitting Logs with OpenTelemetry
For applications running on Fir, you can directly emit rich, structured logs using OpenTelemetry Protocol (OTLP). Our sidecar collectors, integrated with your applications, are configured to accept these logs via both gRPC and HTTP.
For example, in a Go application, you can start sending logs over gRPC with the following code:
    ctx := context.Background()

    conn, err := grpc.DialContext(ctx, "localhost:4317", grpc.WithTransportCredentials(insecure.NewCredentials()))
    if err != nil {
        panic(fmt.Sprintf("Failed to create gRPC connection to sidecar collector: %v", err))
    }

    logExporter, err := otlploggrpc.New(ctx, otlploggrpc.WithGRPCConn(conn))
    if err != nil {
        panic(fmt.Sprintf("Failed to create OTLP gRPC log exporter: %v", err))
    }

    logProvider := otelog.NewLoggerProvider(
        otelog.WithProcessor(otelog.NewBatchProcessor(logExporter)),
    )

    global.SetLoggerProvider(logProvider)
    logger := global.Logger("my-application")
    logger.InfoContext(ctx, "Operation completed successfully")
View Logs
You can view logs with the Heroku CLI, the dashboard, your logging add-on, or in your log drain.
You can’t view logs for apps in spaces with Private Space Logging enabled. Retrieve logs from your log drain instead.
View Logs with the Heroku CLI
If you see an error in your logs, refer to Heroku Error Codes or the troubleshooting articles for more info.
To fetch your app’s most recent logs, use the heroku logs command:
$ heroku logs --app example-app
2010-09-16T15:13:46.677020+00:00 app[web.1]: Processing PostController#list (for 208.39.138.12 at 2010-09-16 15:13:46) [GET]
2010-09-16T15:13:46.677023+00:00 app[web.1]: Rendering template within layouts/application
2010-09-16T15:13:46.677902+00:00 app[web.1]: Rendering post/list
2010-09-16T15:13:46.678990+00:00 app[web.1]: Rendered includes/_header (0.1ms)
2010-09-16T15:13:46.698234+00:00 app[web.1]: Completed in 74ms (View: 31, DB: 40) | 200 OK [http://example-app-1234567890ab.heroku.com/]
2010-09-16T15:13:46.723498+00:00 heroku[router]: at=info method=GET path="/posts" host=example-app-1234567890ab.herokuapp.com" fwd="204.204.204.204" dyno=web.1 connect=1ms service=18ms status=200 bytes=975
2010-09-16T15:13:47.893472+00:00 app[worker.1]: 2 jobs processed at 16.6761 j/s, 0 failed ...
In this example, the output includes log lines from one of the app’s web dynos, the Heroku HTTP router, and one of the app’s workers. See Heroku’s Log Format and Message Ordering for more info.
For Cedar apps, the logs command retrieves 100 log lines by default. You can specify the number of log lines to retrieve (up to a maximum of 1,500 lines) by using the --num (or -n) option.
Heroku’s Fir generation has no log history. heroku logs defaults to a real-time tail.
$ heroku logs -n 200
Real-Time Tail
Similar to tail -f, real-time tail displays recent logs and leaves the session open for real-time logs to stream in. By viewing a live stream of logs from your app, you can gain insight into the behavior of your live application and debug current problems. Heroku’s Fir generation has no log history. heroku logs for Fir apps defaults to a real-time tail.
You can tail your logs using --tail (or -t).
$ heroku logs --tail
When you’re done, press Ctrl+C to return to the prompt.
A real-time tail session automatically terminates after one hour of inactivity.
Filtering
If you only want to fetch logs with a certain source, a certain dyno, or both, you can use the --source (or -s) and --dyno (or -d) filtering arguments:
This sample output is specific to the Cedar generation.
$ heroku logs --dyno router
2012-02-07T09:43:06.123456+00:00 heroku[router]: at=info method=GET path="/stylesheets/dev-center/library.css" host=devcenter.heroku.com fwd="204.204.204.204" dyno=web.5 connect=1ms service=18ms status=200 bytes=13
2012-02-07T09:43:06.123456+00:00 heroku[router]: at=info method=GET path="/articles/bundler" host=devcenter.heroku.com fwd="204.204.204.204" dyno=web.6 connect=1ms service=18ms status=200 bytes=20375

$ heroku logs --source app
2012-02-07T09:45:47.123456+00:00 app[web.1]: Rendered shared/_search.html.erb (1.0ms)
2012-02-07T09:45:47.123456+00:00 app[web.1]: Completed 200 OK in 83ms (Views: 48.7ms | ActiveRecord: 32.2ms)
2012-02-07T09:45:47.123456+00:00 app[worker.1]: [Worker(host:465cf64e-61c8-46d3-b480-362bfd4ecff9 pid:1)] 1 jobs processed at 23.0330 j/s, 0 failed ...
2012-02-07T09:46:01.123456+00:00 app[web.6]: Started GET "/articles/buildpacks" for 4.1.81.209 at 2012-02-07 09:46:01 +0000

$ heroku logs --source app --dyno worker
2012-02-07T09:47:59.123456+00:00 app[worker.1]: [Worker(host:260cf64e-61c8-46d3-b480-362bfd4ecff9 pid:1)] Article#record_view_without_delay completed after 0.0221
2012-02-07T09:47:59.123456+00:00 app[worker.1]: [Worker(host:260cf64e-61c8-46d3-b480-362bfd4ecff9 pid:1)] 5 jobs processed at 31.6842 j/s, 0 failed ...
When filtering by dyno, you can use either the base name (like --dyno web) or the full name ( like --dyno web.1).
You can also combine the filtering switches with --tail to get a real-time stream of filtered output.
$ heroku logs --source app --tail
Additional Filtering Options for Fir
On Heroku’s Fir generation, you can filter by process type using --process-type (or -p). This filter only shows the output from the requested process type, such as web or worker.
All Heroku-specific logs for Fir are prefixed with heroku-.
$ heroku logs --process-type=web
Fetching logs...

2024-11-25T16:58:31.851567+00:00 heroku-router[web]: at=info method=GET path="/" host=guarded-ocean-15115-d8c9cc7de5a9.herokuapp.com request_id=5ff3cd7e-870b-d957-086d-5689c6774271 fwd="204.14.236.210" dyno=web-6f7df4f44d-nq5pr connect=1ms service=0ms status=200 bytes=21 protocol=http tls_version=tls1.3
2024-11-25T16:58:31.921301+00:00 heroku-router[web]: at=info method=GET path="/favicon.ico" host=guarded-ocean-15115-d8c9cc7de5a9.herokuapp.com request_id=6889fc6a-eb78-5366-ea9d-e0198958b15b fwd="204.14.236.210" dyno=web-6f7df4f44d-nq5pr connect=0ms service=1ms status=200 bytes=32 protocol=http tls_version=tls1.3
2024-11-25T16:58:31.851200+00:00 app[web]: 2024/11/25 16:58:31 http: superfluous response.WriteHeader call from github.com/riandyrn/otelchi.getRRW.func2.1 (middleware.go:96)
View Logs with the Heroku Dashboard
You can view your logs on the web by logging into your Heroku dashboard. Navigate to the app you want to see, for example, https://dashboard.heroku.com/apps/<app-name>. On this page, select “more” to see a drop-down menu:

From this menu, select View logs. See Heroku’s Log Format and Message Ordering for more info.
View Logs with a Logging Add-on
This feature is unavailable for Fir-generation apps. Use telemetry drains to add an OpenTelemetry observability backend provider to view logs, traces and metrics. Subscribe to our changelog to stay informed of when we add support for logging add-ons to Fir.
It’s recommended to add one of the Heroku platform’s available logging add-ons to your app. Most of these add-ons offer a free plan to get started. See your add-on’s documentation for instructions on retrieving logs.
Alternatively, you can implement a custom log drain.
Heroku’s Log Format and Message Ordering
Heroku collates and distributes the log entries generated by your app and other components of the platform.
Private Space Logging in Shield Spaces do not use Logplex. See Private Space Logging for its log format.
Logs aren’t in chronological order. Logs originate from many sources and we assemble them into a single log stream. Both Logplex and OpenTelemetry collectors uses a distributed architecture to ensure high availability, so log messages can also be out of order as they collect across multiple application nodes.
The output format of the heroku logs command is as follows:
timestamp source[dyno]: message
- Timestamp - The date and time recorded at the time the dyno or component produced the log line. The timestamp is in the format specified by RFC5424, and includes microsecond precision.
- Source - All of your app’s dynos (web dynos, background workers, cron) have the source,
app. All of Heroku’s system components (HTTP router, dyno manager) have the source,herokuon Cedar and the prefixheroku-on Next Generation. - Dyno - The name of the dyno or component that wrote the log line. For example, worker #3 appears as
worker.3, and the Heroku HTTP router appears asrouterorheroku-routeron Cedar and Fir respectively. - Message - The content of the log line. We split any lines generated by dynos that exceed 10,000 bytes into 10,000-byte chunks without extra trailing newlines. It submits each chunk is submitted as a separate log line.