Last updated January 29, 2026
This add-on is operated by SolarWinds Worldwide, LLC
Powerful, affordable, and easy to use application performance monitoring.
The AppOptics team is replacing AppOptics with enhancements to the Papertrail add-on, combining both logs and metrics. We will remove the AppOptics add-on from all apps on February 2nd, 2026.
AppOptics is an add-on for monitoring the performance of your Heroku application, the dyno and routing infrastructure, and other metrics that are important to you.
Turnkey monitoring

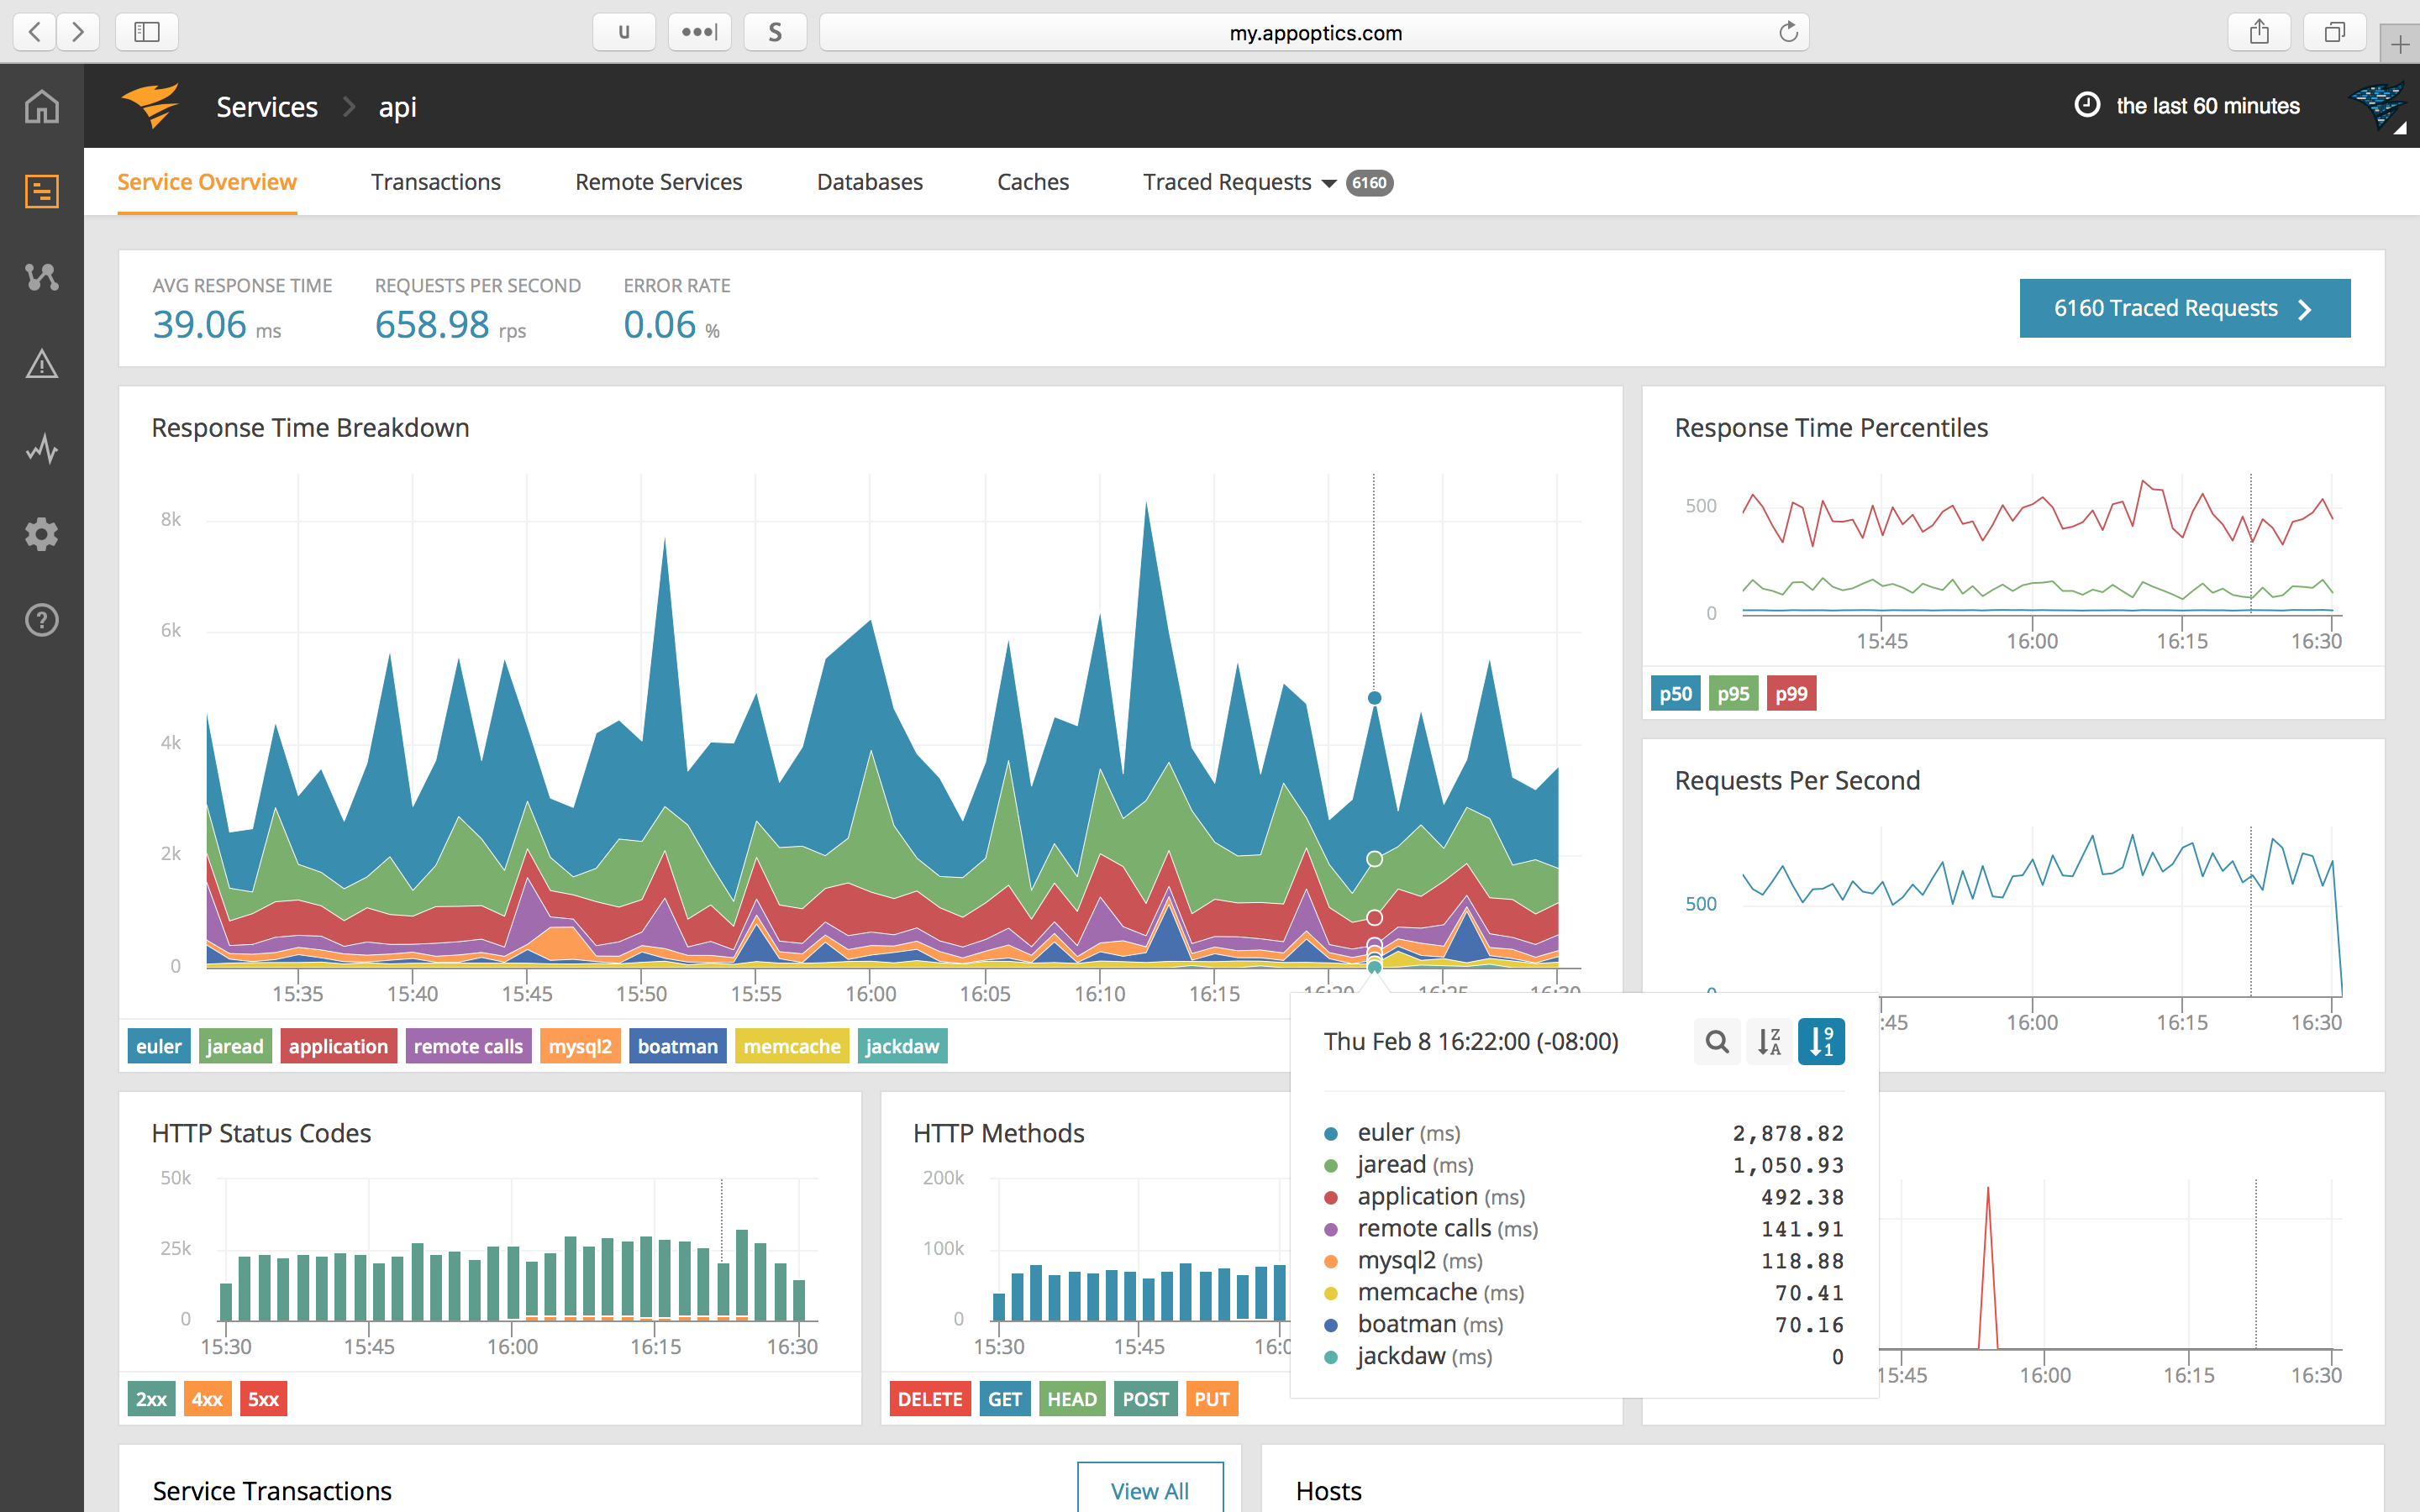
Simply activating the AppOptics add-on will provide a dashboard of key performance metrics and alerting. No code changes or redeploys required. See “Getting Started”.
APM, database, and error analytics

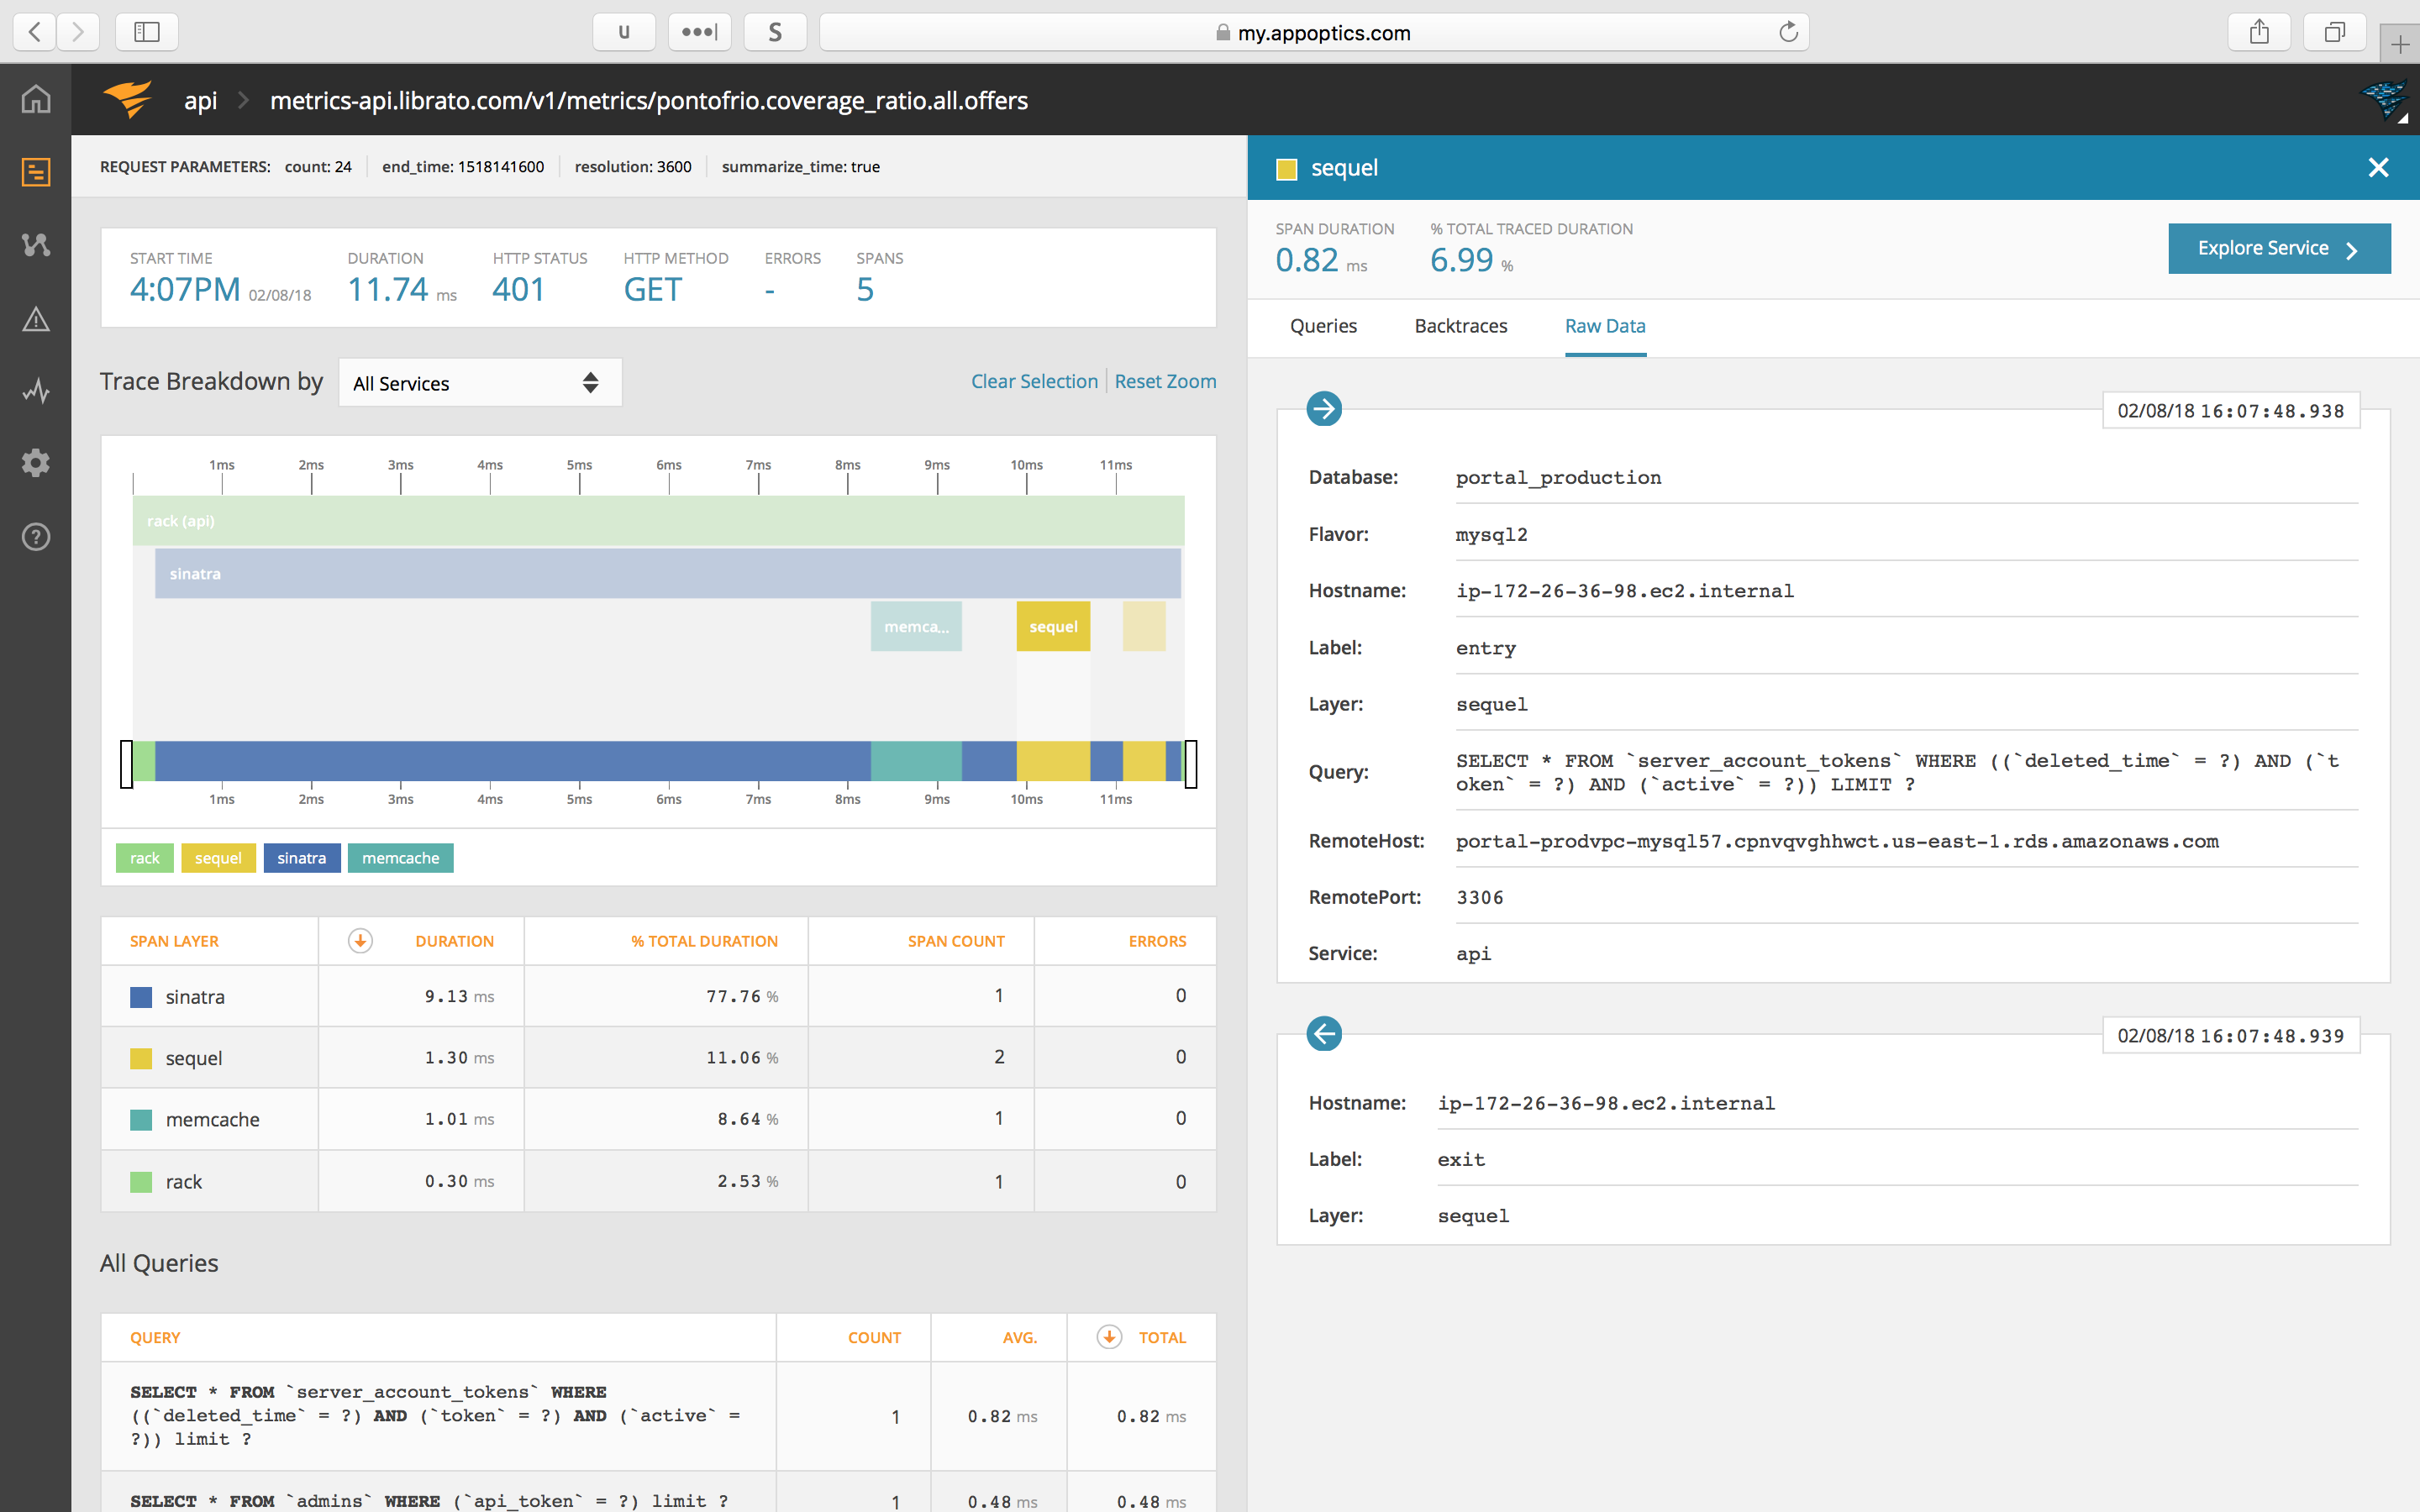
Adding our APM agent–available as a module or package for Ruby, Python, Node.js, PHP, Java, and Golang applications–extends visibility to include error analytics, query performance, detailed transaction timing data, distributed tracing, and more. See “Enabling APM”.
Custom metrics

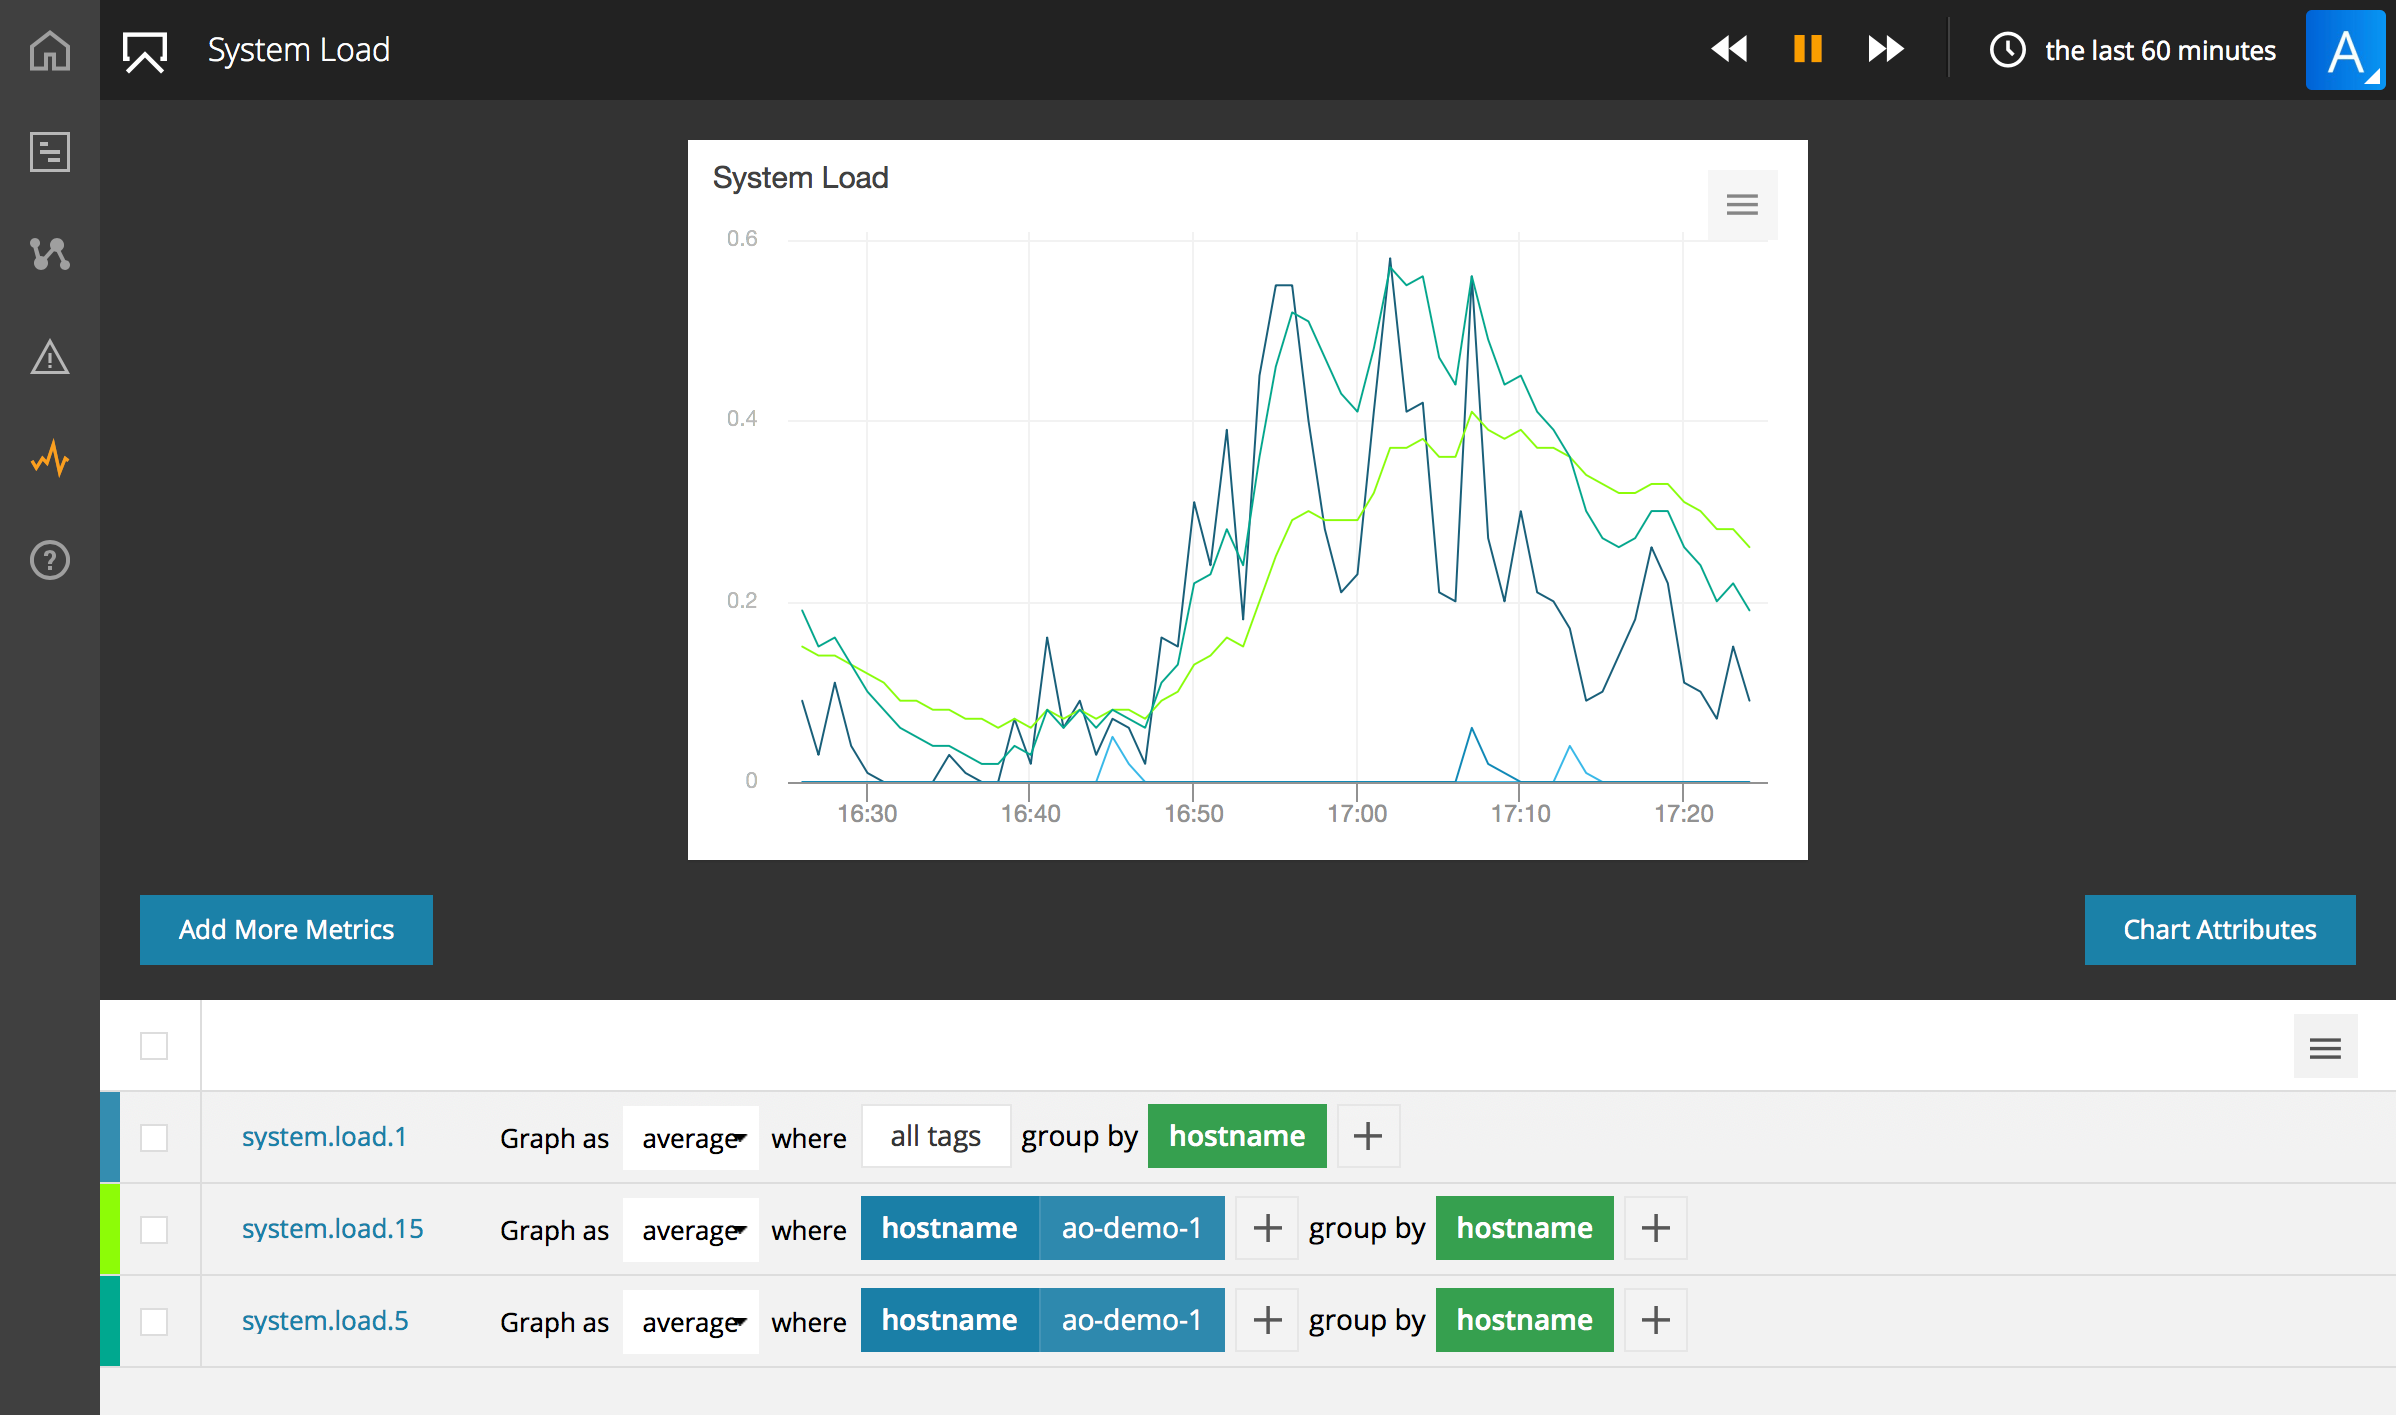
Collecting custom metrics in AppOptics is as easy as logging to stdout. And it’s a full-fledged metrics and dashboarding product, so anything you want to monitor you can trend, dashboard, and alert on. See “Custom metrics”.
Getting started
AppOptics can be attached to a Heroku application via the add-on page or via CLI. Here’s an example of provisioning the add-on with the segue plan tier:
heroku addons:create appoptics:segue
Creating appoptics-elliptical-89104... done, (segue)
Adding appoptics-elliptical-89104 to myappname... done
After successful provisioning, the native log-based metrics described below will automatically begin flowing into your AppOptics account and into a dashboard we’ve pre-configured to provide an overview of your application and database performance. It may take 2-3 minutes for data to appear. You can go to the AppOptics interface via your control panel to check things out, or read on to learn more!
Enabling APM
AppOptics provides agents that automatically monitor applications, generating both metrics about an application’s performance (APM), detailed distributed transaction traces (tracing), and error data.
Installing APM is as simple as adding our agent/SDK to your application and re-deploying. See below for instructions in each supported language.
Note that enabling the add-on will configure the agent to report into a new AppOptics account dedicated to the application, by automatically setting a APPOPTICS_SERVICE_KEY that points to the new account. If you have an existing AppOptics account and wish to use that instead, you can override the APPOPTICS_SERVICE_KEY on the dyno:
heroku config:set APPOPTICS_SERVICE_KEY="<your service key>" --app <app_name>
The service key should be in the format of <API Token>:<Service Name> where the API Token is from your existing AppOptics account and the service name can be any custom value, for example 123...def:my-heroku-service.
Ruby
The Ruby agent is hosted on RubyGems, making installation as simple as gem install appoptics_apm or adding gem 'appoptics_apm' to the end of your Gemfile if the application manages gems via bundler.
Ideally all application gems are required by Bundler.require, which guarantees loading in the order they appear in the Gemfile. Otherwise make sure to require 'appoptics_apm' only after all gems that need instrumentation are loaded.
Rails / Rack example
To install the agent on anything rack-based, like Rails, add the gem to the end of the application’s Gemfile:
source 'https://rubygems.org'
ruby '2.5.2'

…

gem 'appoptics_apm’
Then re-deploy your application:
git commit -a -m "add appoptics monitoring"
git push heroku master
Sinatra example
To install the agent, add the gem to the end of the application’s Gemfile:
source 'https://rubygems.org'
ruby '2.5.2'

gem 'sinatra'
gem 'appoptics_apm’
and require it after sinatra in the application code:
require 'sinatra'
require 'appoptics_apm'

get '/' do
  "Hello world!"
end
Optionally, update the dependencies locally with bundler:
bundle install
(Note that on OS X and other unsupported platforms the agent will install but go into no-op mode.)
When ready, re-deploy the application:
git commit -a -m "add appoptics monitoring"
git push heroku master
Other ruby frameworks
More information about our Ruby agent, including examples for Grape, Padrino, Rails / Rails metal controllers, and Sinatra can be found in the Ruby agent documentation.
See the Enabling APM section on how to configure the agent to use an existing AppOptics account.
Node.js
The Node.js agent is distributed as an npm package and can be installed via npm install appoptics-apm, then added to your application by requiring it before any other modules.
To install the agent, add it to the application’s package.json file:
{
  "name": "node-js-getting-started",
  "version": "0.3.0",
  ...
  "engines": {
    "node": "8.x”
  },
  "dependencies": {
    "ejs": "^2.5.6",
    "express": "^4.15.2",
    “appoptics-apm”: “5.9.2”
  },
  ...
}
and require it in the application entry point file before any other require() calls:
// must be first require
require('appoptics-apm')
const express = require('express')
const path = require('path')
const PORT = process.env.PORT || 5000

express()
  .use(express.static(path.join(__dirname, 'public')))
  .set('views', path.join(__dirname, 'views'))
  .set('view engine', 'ejs')
  .get('/', (req, res) => res.render('pages/index'))
  .listen(PORT, () => console.log(`Listening on ${ PORT }`))
Optionally, update the dependencies locally with npm:
npm install
(Note that on OS X and other unsupported platforms the agent will install but go into no-op mode.)
When ready, re-deploy the application:
git commit -a -m "add appoptics monitoring"
git push heroku master
More information about our Node.js agent can be found in the Node agent documentation.
See the Enabling APM section on how to configure the agent to use an existing AppOptics account.
Python
The Python agent is distributed as a PyPI package and can be installed via pip install appoptics-apm, then added to your application by importing its middleware or handler wrapper.
Django example
To install the agent, add it to the application’s requirements.txt file:
django
gunicorn
appoptics-apm
and import its django middleware wrapper in the application’s settings.py file:
import os
from appoptics_apm import djangoware
...
Optionally, update the dependencies locally with pip.
pip install -r requirements.txt
(Note that on OS X and other unsupported platforms the agent will install but go into no-op mode.)
When ready, re-deploy the application:
git commit -a -m "add appoptics instrumentation"
git push heroku master
Other python frameworks
More information about our Python agent, including examples for Django, Flask and generic WSGI, and Tornado can be found in the Python agent documentation.
See the Enabling APM section on how to configure the agent to use an existing AppOptics account.
PHP
The PHP agent is distributed as an extension .so binary file that supports many popular Linux distros, and can be easily installed for your application by using the custom buildpack.
Note that our custom buildpack is a fork of the official heroku/php buildpack, and should be used to replace it. This can be done using the Heroku web console under the ‘Settings > Buildpacks’ tab, or with the Heroku CLI as shown below.
List current buildpack:
$ heroku buildpacks
=== app-name-12345 Buildpack URL
heroku/php
Replace the default php buildpack with our custom one:
$ heroku buildpacks:set https://github.com/appoptics/heroku-buildpack-apm-php.git
Buildpack set. Next release on app-name-12345 will use https://github.com/appoptics/heroku-buildpack-apm-php.git.
Run git push heroku master to create a new release using this buildpack.
It is possible to customize the agent install by setting these optional Config Vars:
APPOPTICS_EXTENSION_DIR: PHP extension directory (will attempt to detect automatically if not set)APPOPTICS_INI_DIR: PHP INI directory (will attempt to detect automatically if not set)APPOPTICS_THREAD_SAFETY: install thread-safe (TS) or non-thread-safe (NTS) version (will attempt to detect automatically if not set)APPOPTICS_VERSION: version to install (default: latest)APPOPTICS_URL: URL to get the PHP agent from (default: https://files.appoptics.com/php)
After the buildpack has been added and all desired Config Vars have been set, the app can be re-deployed as usual and will have the PHP instrumentation enabled.
More information about our PHP agent can be found in the PHP agent documentation.
See the Enabling APM section on how to configure the agent to use an existing AppOptics account.
Java
The Java agent is distributed as the appoptics-agent.jar file that should be loaded on JVM startup via the -javaagent option.
Deploying with Git
To install the agent, create a dedicated sub-directory, e.g. appoptics-agent, under your local application source tree and change into that directory:
$ pwd
/home/example/heroku/java-getting-started
$ mkdir appoptics-agent/
$ cd appoptics-agent
Download appoptics-agent.jar and its sha256 from the desired release directory, e.g. latest, verify the checksum, then git add the agent jar so that it will be part of the application resource:
curl -LO https://files.appoptics.com/java/latest/appoptics-agent.jar
curl -LO https://files.appoptics.com/java/latest/appoptics-agent.jar.sha256
…
git add appoptics-agent.jar
Now edit the application Procfile to include the -javaagent option which should point to the downloaded agent jar file. An example of the Procfile content:
web: java -javaagent:appoptics-agent/appoptics-agent.jar -jar target/java-getting-started-1.0.jar
When ready, re-deploy the application:
git commit -a -m "add appoptics instrumentation"
git push heroku master
Deploying as war with Heroku CLI
Download appoptics-agent.jar and its sha256 from the desired release directory, e.g. latest, verify the checksum
curl -LO https://files.appoptics.com/java/latest/appoptics-agent.jar
curl -LO https://files.appoptics.com/java/latest/appoptics-agent.jar.sha256
Include the agent jar as an additional file in your slug with the --includes option. For example:
heroku war:deploy <path_to_war_file> --includes appoptics-agent.jar --app <app_name>
Configure the JAVA_OPTS:
heroku config:set JAVA_OPTS="-javaagent:appoptics-agent.jar" --app <app_name>
The dyno will restart with our Java agent enabled.
Optional files
Note that additionally, each release comes with optional files:
appoptics-sdk.jar: the instrumentation SDK jar file that can be used to provide custom tracing calls to the applicationjavaagent.json: JSON configuration file to customize agent behavior
More information about these, and other options in our Java agent can be found in the Java agent documentation.
See the Enabling APM section on how to configure the agent to use an existing AppOptics account.
Golang
The Go agent is an open-source project that provides wrappers and SDK calls that your application can use to instrument web requests and other workloads. Instrumentation is possible using our simple hooks, or with OpenTracing 1.0 API support.
The example below uses a very simple web app, the full source can be found in the agent’s example directory.
To install the agent, add the github.com/appoptics/appoptics-apm-go/v1/ao package to the application, below is an example using govendor:
govendor fetch github.com/appoptics/appoptics-apm-go/v1/ao
Then, use its wrappers or SDK calls to instrument the app. Relevant code snippets from the example web app:
// Wraps a standard HTTP handler with AppOptics instrumentation
package main

import (
        ...
        "github.com/appoptics/appoptics-apm-go/v1/ao"
)
…
func slowHandler(w http.ResponseWriter, r *http.Request) {
        time.Sleep(normalAround(2*time.Second, 100*time.Millisecond))
        w.WriteHeader(404)
        fmt.Fprintf(w, "Slow request... Path: %s", r.URL.Path)
}
...
func main() {
        http.HandleFunc("/slow", ao.HTTPHandler(slowHandler))
        ...
When ready, re-deploy the application:
git commit -a -m "add appoptics instrumentation"
git push heroku master
More information can be found in the Golang agent documentation.
See the Enabling APM section on how to configure the agent to use an existing AppOptics account.
Custom metrics
In addition to seamlessly extracting native metrics provided by Heroku, AppOptics’ log integration enables you to publish your own custom metrics directly to AppOptics through the Heroku log stream. Simply write your measurements to standard output (stdout) using one of the formats specified below and AppOptics will automatically detect and collect your custom metrics.
Once you collect custom metrics, you can build dashboards and set up alerts with them.
The examples below are in Ruby syntax but can be replicated in any language that permits writing to standard output.
Custom counting
Count log lines are used to submit increments to AppOptics. You can submit increments as frequently as desired and every minute the current total will be flushed to AppOptics and reset to zero. For example the following combination would result in a value of 5 being recorded for the enclosing minute in a AppOptics metric named user.clicks:
$stdout.puts("count#user.clicks=1")
$stdout.puts("count#user.clicks=1")
$stdout.puts("count#user.clicks=3")
Aggregation is done on a per-tag basis; in the following case, user.clicks for user_id=1 receives a count of 1, while user_id=2 receives a count of 4:
$stdout.puts("count#user.clicks=1 tag#user_id=2")
$stdout.puts("count#user.clicks=1 tag#user_id=1")
$stdout.puts("count#user.clicks=3 tag#user_id=2 ")
Custom distributions
Measure log lines are used to submit individual measurements that comprise a statistical distribution. The most common use case are timings i.e. latency measurements, but it can also be used to represent non-temporal distributions such as counts. You can submit as many measures as you’d like (typically they are submitted per-request) and every minute AppOptics will calculate/record a complete set of summary statistics over the measures submitted in that interval:
- min - The smallest value.
- max - The largest value.
- average - The average of all values.
- median - The value that falls precisely in the middle of all values. Considered a good indicator of typical application performance.
- 95th percentile - The value that is larger than 95% of all values.
- 99th percentile - The value that is larger than 99% of all values.
- sum - The total of all values.
- count - The total number of values submitted.
Measures are submitted in a similar fashion to counts:
$stdout.puts("measure#database.query=200ms")
Note that measures create 4 separate metrics in AppOptics based on the submitted measure name. Using the example above, you would find:
database.query- A complex metric that contains the min/mean/max/sum/count values. You can switch between them using AppOptics’ summary statistics support.database.query.median- The median value.database.query.perc95- The 95th percentile value.database.query.perc99- The 99th percentile value.
All metrics are aggregated for each combination of the provided tags; more on tagging below.
Custom sample metrics
Sample metrics are used to convey simple key/numerical value pairs when you are already calculating some kind of summary statistic in your app and merely need a simple transport mechanism to AppOptics. Typically you would submit sample metrics on some periodic tick and set said period on the metric in AppOptics. This example would create a metric in AppOptics with the name database.size:
$stdout.puts("sample#database.size=40.9MB")
Metrics are aggregated for each combination of the provided tags; more on tagging below.
Tagged metrics
AppOptics metrics support multidimensional tagging, meaning that you can associate a particular observation with one or more attributes you would like to be able to query/report on. In Heroku logging, this is done using a syntax of tag#tag1=value1 tag#tag2=value2 on the same line as the measurement being recorded (before or after the measurement itself).
For example, we can track the rate of requests to our API by both endpoint and customer, as well as by both:
$stdout.puts("count#api.volume=1 tag#api_endpoint=lookup tag#customer_id=123")
Note that metrics will automatically be tagged with the service name as part of the reporting process, so you don’t need to add that.
Native log-based metrics
After provisioning the add-on, AppOptics immediately begins collecting native Heroku metrics directly from your application’s log stream.
Router metrics are present in every Heroku application log stream and provide detailed information (including timing) about every request serviced by your application. As these details are sourced directly from the Heroku routing layer itself, it’s the truest measure of performance as experienced by your customers, accounting for any delays introduced by Heroku in addition to your application’s processing. AppOptics calculates a rich set of summary statistics (described below in custom distributions) including median, 95th percentile, and 99th percentile latency that provide unprecedented insight into your application’s performance. The metrics (described in the linked Heroku router docs) available in AppOptics currently are:
heroku.router.http.requests[service, dyno, status_code, method]- Request count by application, dyno, HTTP status code, and methodheroku.router.service.response_time[service, dyno, method]- Amount of time in milliseconds for the application to respond to a HTTP requestheroku.router.service.response_time.p50[service, dyno, method]- 50th percentile response timeheroku.router.service.response_time.p95[service, dyno, method]- 95th percentile response time-
heroku.router.service.response_time.p99[service, dyno, method]- 99th percentile response time
heroku.router.connect.latency[service, dyno]- Amount of time in milliseconds spent establishing a connection to the backend web processheroku.router.connect.latency.p50[service, dyno]- 50th percentile connect latencyheroku.router.connect.latency.p95[service, dyno]- 95th percentile connect latencyheroku.router.connect.latency.p99[service, dyno]- 99th percentile connect latency
The heroku.router.http.requests metrics capture all 200, 300, 400 and 500-level status codes from the Heroku Router for your applications.
Additionally, these metrics include counts and breakdowns of common runtime errors, tagged by error code:
heroku.errors.http[service, code]heroku.errors.logging[service, code]heroku.errors.runtime[service, code]
Postgres metrics are present in the log stream of any Heroku application with a provisioned Heroku Postgres database on a standard or premium tier. These metrics are summary statistics gathered by the Heroku Postgres service and are reported directly into AppOptics:
heroku.postgres.load.load1[service, database, addon]heroku.postgres.load.load5[service, database, addon]heroku.postgres.load.load15[service, database, addon]heroku.postgres.mem.total[service, database, addon]heroku.postgres.mem.free[service, database, addon]heroku.postgres.mem.cached[service, database, addon]heroku.postgres.mem.postgres[service, database, addon]heroku.postgres.db.size[service, database, addon]heroku.postgres.db.tables[service, database, addon]heroku.postgres.db.connections_active[service, database, addon]heroku.postgres.db.connections_waiting[service, database, addon]heroku.postgres.db.current_transaction[service, database, addon]heroku.postgres.db.index_cache_hit_rate[service, database, addon]heroku.postgres.db.table_cache_hit_rate[service, database, addon]heroku.postgres.db.read_iops[service, database, addon]heroku.postgres.db.write_iops[service, database, addon]
Tags: service is the connected app name, database is the database attachment name, and addon is the addon name.
Per-dyno runtime metrics are available to any Heroku application, but must be enabled by the user, as they are disabled by default. They provide insight into both memory usage and CPU load of each dyno and are reported with @host tag values of the dyno’s logical role e.g. web.1 or worker.2. You can enable them with the following commands:
heroku labs:enable log-runtime-metrics
Enabling log-runtime-metrics for ... done
heroku restart
Once enabled, your per-dyno runtime metrics will automatically begin showing up in your AppOptics account. These metrics are summary statistics gathered by the Heroku Runtime layer and are reported directly into AppOptics under their given names.
heroku.dyno.load.load1[service, dyno]heroku.dyno.load.load5[service, dyno]heroku.dyno.load.load15[service, dyno]heroku.dyno.mem.rss[service, dyno]heroku.dyno.mem.swap[service, dyno]heroku.dyno.mem.cache[service, dyno]heroku.dyno.mem.total[service, dyno]heroku.dyno.mem.pgout[service, dyno]heroku.dyno.mem.pgin[service, dyno]heroku.dyno.mem.quota[service, dyno]
AppOptics Interface
For more information on the features available within the AppOptics interface please see the AppOptics knowledge base.
The AppOptics interface allows you to see per-app service performance, build custom dashboards, set threshold-based alerts, rapidly detect and diagnose performance regressions in your production infrastructure, gain a deeper, shared understanding of your business across your team, and so more!.

The interface can be accessed via the CLI:
$ heroku addons:open appoptics
Opening appoptics for sharp-mountain-4005...
or by visiting the Heroku Dashboard and selecting the application in question. Select AppOptics from the Add-ons menu.
Alerts
With AppOptics alerts, we’ll notify you when one of your key metrics exceeds a threshold or stops reporting. You can be notified via email, PagerDuty, Slack, webhook, or a number of other possible services.
To get you started, your Add-On account comes preconfigured with two alerts (which are disabled by default), designed to help you stay on top of problematic code deploys:
- Your application returns errors (HTTP 5xx response codes) for more than 1% of requests
- Your application’s response time averages over 1 second
These alerts are configured to email the Heroku account owner. To customize and enable these alerts, first visit the alerts page. Then, to enable an alert, click on the alert name or on the edit button. On the page that opens, click on enabled, then save.
To learn more about AppOptics alerts, visit our knowledge base article.
General troubleshooting
It may take 2-3 minutes for the first results to show up in your AppOptics account after you have deployed your app and the first request has been received.
Note that if Heroku idles your application, measurements will not be sent until it receives another request and is restarted. If you see intermittent gaps in your measurements during periods of low traffic, this is the most likely cause.
For troubleshooting APM or custom instrumentation, see our language-specific guides in the documentation.
Picking a plan
Depending on your intended usage level there are several plans to choose from. Plans are sized in terms of average dyno use. (You won’t be penalized for scaling up or down in the short term.)
AppOptics plans include a number of custom metrics with each plan tier, increasing roughly in proportion with the number of dynos monitored. Note that extensive use of custom metrics may cause your usage to fall into a higher plan tier–we’ll reach out if that happens.
All plans include the native router, dyno, and database metrics, as well as APM and custom metrics. Dashboarding, alerting, and API too!
Migrating between plans
You can migrate between plans at any time without any interruption to your metrics.
Use the heroku addons:upgrade command to migrate to a new plan.
$ heroku addons:upgrade appoptics:andromeda
-----> Upgrading appoptics:sombrero to sharp-mountain-4005... done, v18 ($139/mo)
       Your plan has been updated to: appoptics:andromeda
Removing the add-on
AppOptics can be removed via the CLI.
This will destroy all associated data and cannot be undone!
$ heroku addons:destroy appoptics
-----> Removing appoptics from sharp-mountain-4005... done, v20 (segue)
Before removing AppOptics, data can be exported through the AppOptics API.
Terms of Service
By installing the AppOptics Add-on, you agree to the Software Service Agreement.
Support
All AppOptics support and runtime issues should be submitted via one of the Heroku Support channels. Any non-support related issues or product feedback for AppOptics is welcome via email.