Table of Contents [expand]
- Why use Graphite?
- Metric format
- Provisioning the add-on
- Heroku dashboards
- Heroku add-on metrics
- Additional features
- Custom dashboards
- Using Hosted Graphite with various languages
- Using with Ruby
- Using with Python
- Using with PHP
- Using with Java
- Using with Node.js
- Troubleshooting
- Migrating between plans
- Removing the add-on
- Support
- Additional resources
Last updated December 17, 2025
This add-on is operated by Hosted Graphite
Application, System, and Infrastructure monitoring via Graphite and Grafana
Hosted Graphite is an add-on for providing application performance metrics via your app’s Log Drains.

Graphite is one of the most widely-used and well-tested metric platforms, used by small developers and large companies alike. Hosted Graphite has improved upon standard Graphite and offers aggregation, alerting, data storage, team access, and additional integrations and features that provide customers with a robust and well-rounded monitoring solution.
Additionally, Hosted Graphite supports sending custom metrics from any programming language, has deployable agents that will return system metrics from your running servers, and has integrations with many popular technologies like AWS, Azure, and GCP that allow you to monitor multiple services under a single pane of glass.
Why use Graphite?
Graphite is an open-source graphing system for time-series data. It features a storage backend (Whisper), a query language with built-in functions for data manipulation, and a basic web interface for visualizations. Metrics sent to Graphite’s carbon endpoint are timestamped, stored, can be graphed, and it is a well-documented and user-friendly tool for monitoring and analyzing time-series data.
Hosted Graphite by MetricFire takes away the burden of self-hosting your own monitoring solution, allowing you more time and freedom to work on your most important tasks. You can measure, analyze, and visualize large amounts of data from your applications and infrastructure without the hassles of setting up your own servers, worrying about scaling, storing data, alerting, or maintenance. Hosted Graphite also has many supported APIs, integrations, and plugins that can help you get data in, and return it in a way that is useful for you. Anytime you have questions about our product and services, our knowledgeable support team will respond quickly and give you useful advice.
Metric format
Hosted Graphite messages are sent in the following format:
apikey.metric.path value timestamp
Where apikey is your Hosted Graphite API key, metric.path is the dot-notated name of the metric, value is the numeric data sent with the metric name. Timestamp is automatically included at the time of ingestion, but can optionally be included.
Provisioning the add-on
Hosted Graphite can be attached to a Heroku application through the Heroku UI or CLI:
$ heroku addons:create hostedgraphite -a <app-name>
-----> Adding hostedgraphite to sharp-mountain-4005... done, v18 (free)
The default plan is ‘Intro’, and once the Hosted Graphite Add-On has been added, a HOSTEDGRAPHITE_APIKEY setting will be available in the app configuration, which contains your Hosted Graphite API Key used to send metric data to the service. This can be confirmed using the heroku config:get command.
$ heroku config:get HOSTEDGRAPHITE_APIKEY -a <app-name>
deadbeef-dead-beef-fade-feedbeefdead
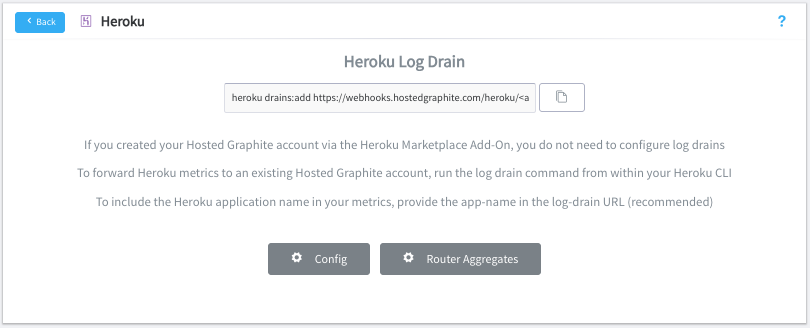
After installing the Hosted Graphite add-on, your application’s log drains will be forwarded to your Hosted Graphite account and your app’s dyno/router data will be displayed on an automatically created Grafana dashboard named ‘Heroku’. Make sure that log-runtime metrics are enabled for your Heroku app:
$ heroku labs:enable log-runtime-metrics -a <app-name>
$ heroku restart -a <app-name>
A list of all plans available can be found here.
Heroku dashboards
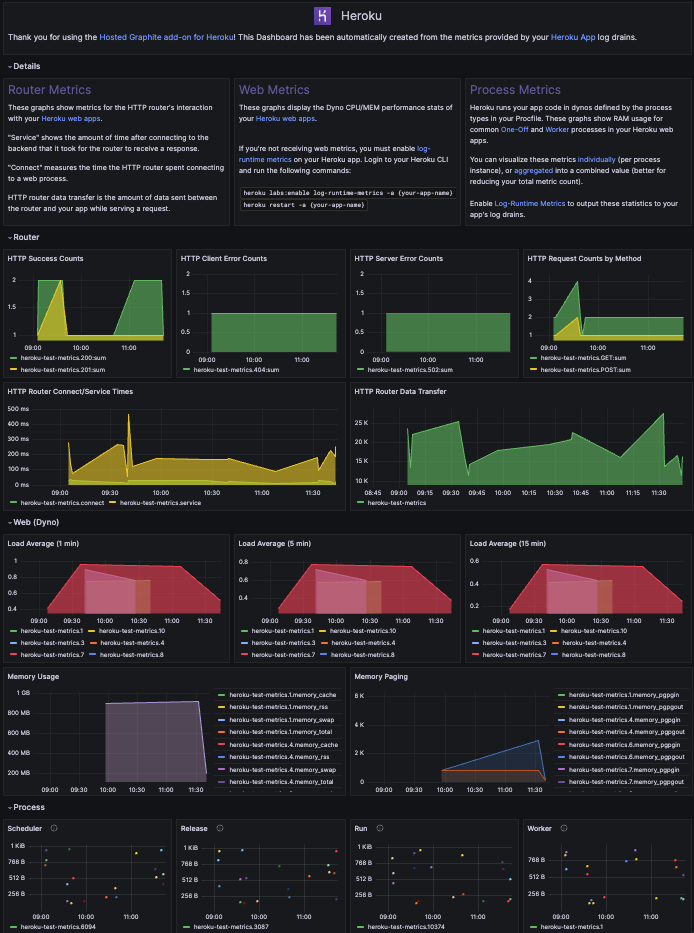
Several Dashboards will be automatically created when you enable the Heroku Add-On (Heroku Dynos, Postgres, Redis, Kafka):

Using Heroku’s Drain and Log-Runtime metrics, we retrieve and process Heroku’s syslog information for your Dynos including:
CPU Load average - 1/5/15-minute averages
Memory and Swap - Resident memory, disk cache, swap, total memory, and cumulative totals for pages written to/read from disk.
HTTP Router metrics - The number of requests broken down by HTTP method/status code, data transferred, connect/service times, and processes.
Heroku add-on metrics
If you use the Postgres add-on in your Heroku app at the standard or premium plan level, these metrics will also be automatically forwarded to your Hosted Graphite account. They are prefixed with: heroku.{app-name}.heroku-postgres.{instance-name} and report server metrics for CPU load/memory. Additionally, you will receive more specific database metrics such as size, tables, active/waiting-connections, tmp-disk-available/used, read/write-iops, and more!

Hosted Graphite will also collect metrics from your Heroku App’s Redis and Kafka Add-Ons, as well as most Heroku Processes (scheduler, release, run, worker, etc) running in your application.
Additional features
Hosted Graphite allows additional customization options for your Heroku metrics:

Router Path Metrics
If you enable the Path Metrics feature in the Heroku Config, we will collect and forward router statistics (connection times, request methods/statuses) per path in your Heroku application. This will increase the total number of metrics being stored in the Hosted Graphite backend, but will give you increased visibility into activity within your app, and a higher level of alerting functionality.
Path Aggregates
If you have Path Metrics enabled, but experience a high cardinality of metrics due to unique identifiers being created in your app’s URLs, our Router Aggregates feature will combine these values to reduce your metric overhead.
Process Aggregates
Heroku runs your app code in Dynos defined by One-Off and Worker process types in your Procfile (you must have Log-Runtime Metrics enabled on your Heroku app to receive process metrics). This feature rolls up multiple process instance IDs into a single metric stream, which is good for reducing cardinality and giving you a good performance overview. By default, you will receive individual process metrics, but we recommend enabling aggregation per process to significantly decrease your total metric count.
Host Aggregates
Some Heroku apps report router metrics under multiple hostnames, such as a mix of your Heroku default domain (myapp.herokuapp.com), a custom domain (www.myapp.com), or internal service domains. These variations can create separate metric series even though they represent the same application. The Host Aggregation feature adds the host name into the metric path and groups router metrics by the first subdomain label and effectively aggregates all subdomains under that label.
Event Annotations
We also provide a convenient webhook that you can upload to your Heroku account and import real-time Heroku events to your Hosted Graphite account. Just add our HG webhook into your Heroku account, you can configure annotations on your dashboards to display events from your Heroku environment around deployments, builds, domains, collaborators, add-ons, and more.
See the Hosted Graphite docs for more details and examples around our Additional Features.
Custom dashboards
The Hosted Graphite dashboards allow you to view all of your created metrics, and create highly customizable graphs to display your data.
The Hosted Graphite account and dashboards can be accessed via the CLI:
$ heroku addons:open hostedgraphite
Opening hostedgraphite for sharp-mountain-4005...
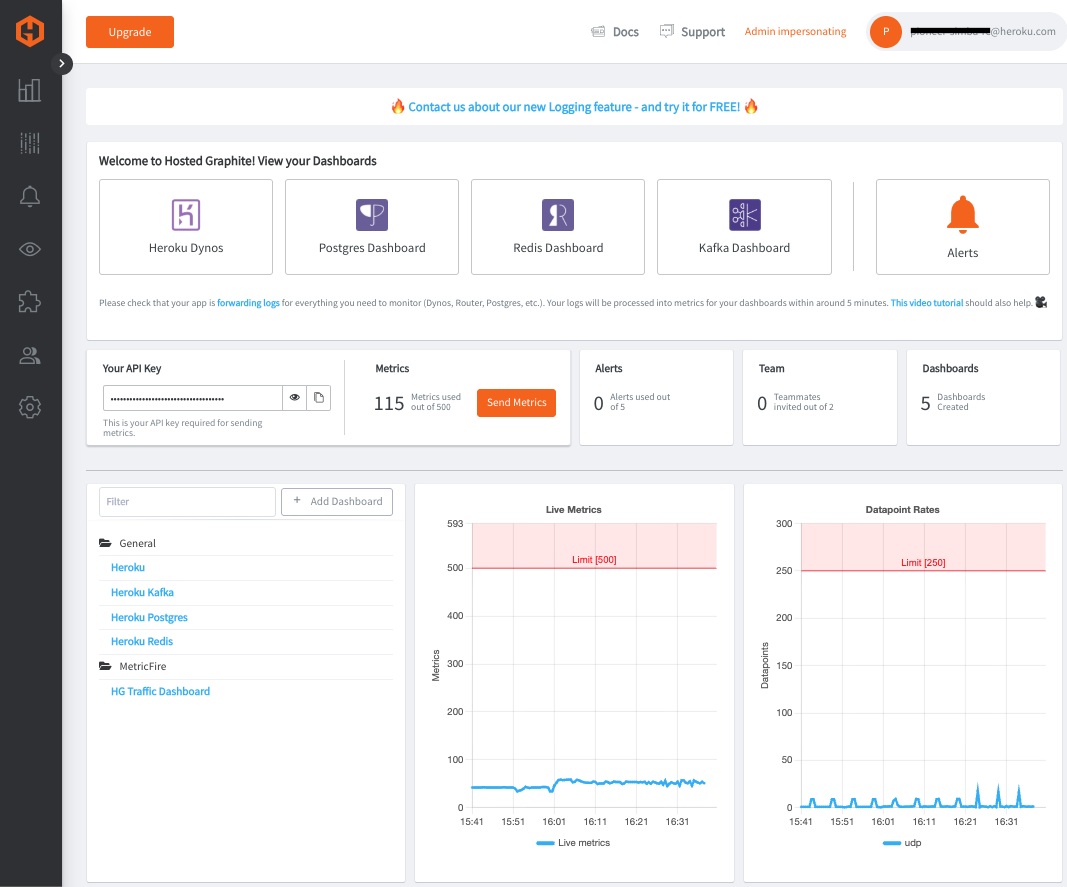
or through the Heroku UI by selecting Hosted Graphite from the Add-ons menu in the Resources tab:

Then navigate to Dashboards from the main Hosted Graphite page, and it will open the Hosted Grafana portion of the add-on:

From here you can create custom dashboards and panels to display your metric data:

For full details on the Heroku, Grafana, and Graphite features available within the Hosted Graphite Add-On please see the docs at https://docs.hostedgraphite.com/.
Environment setup
After provisioning the add-on it may be necessary to locally replicate the config vars so your development environment can operate against the service.
Though less portable it’s also possible to set local environment variables using export HOSTEDGRAPHITE_APIKEY=value.
Use the Heroku Local command-line tool to configure, run and manage process types specified in your app’s Procfile. Heroku Local reads configuration variables from a .env file. To view all of your app’s config vars, type heroku config. Use the following command to add the HOSTEDGRAPHITE_APIKEY values retrieved from heroku config to your .env file.
$ heroku config -s | grep HOSTEDGRAPHITE_APIKEY >> .env
$ more .env
Credentials and other sensitive configuration values should not be committed to source-control. In Git exclude the .env file with: echo .env >> .gitignore.
Using Hosted Graphite with various languages
In the following code snippets, the HOSTEDGRAPHITE_APIKEY is automatically pulled from the local environment, and refers to the value returned from the heroku config:get HOSTEDGRAPHITE_APIKEY command listed in the provisioning section.
Calculations such as summing or averaging data can be configured on the graph via the Hosted Graphite dashboard.
Data can be sent to Hosted Graphite using both TCP and UDP methods. In these examples the code sends a hypothetical measurement of a web request which took 1444ms. The value sent is numeric, and doesn’t require that you give a specific type measurement. See the Hosted Graphite Language Guide for more details.
TCP Connection
If you’re sending very low volumes of data and are adamant that every single packet needs to be received and measured, TCP is the way to go. There is a slightly larger overhead than UDP due to the nature of the connection, but still should not have any noticeable impact on your application. However, for 99% of users, UDP is the most appropriate option. Send a test metric via TCP through your terminal using the netcat utility:
$ echo "YOUR-API-KEY.test.testing 1.2" | nc carbon.hostedgraphite.com 2003
UDP Connection
If you’re sending any volume of metric data, UDP is preferred due to it’s low overhead, and asynchronous data transmission. With UDP there is a small chance that some packets never arrive at the destination, but in practice very little is lost - certainly not enough that would have any measurable impact on your graphs. Send a test metric via UDP through your terminal using the netcat utility:
$ echo "YOUR-API-KEY.test.udp.metric 1.2" | nc -uw0 carbon.hostedgraphite.com 2003
HTTP Connection
Make a POST for your metrics to the following URL: https://www.hostedgraphite.com/api/v1/sink Here’s an example using curl on linux, which lets you provide the API key in the URL:
$ curl https://YOUR-API-KEY@www.hostedgraphite.com/api/v1/sink --data-binary "test.http.metric 1.2"
StatsD Connection
StatsD is commonly used as a pre-aggregation service and sends metrics via UDP by default. First, you need to enable StatsD in your account through Add-Ons => Hosted StatsD. The following simple example shows how to send a single counter metric to Hosted Graphite’s StatsD endpoint using the netcat utility:
$ echo "YOUR-API-KEY.test.statsd.metric:1.2|c" | nc -u -w1 statsd.hostedgraphite.com 8125
Using with Ruby
TCP Connection
require 'socket'

apikey = ENV['HOSTEDGRAPHITE_APIKEY']
conn   = TCPSocket.new 'carbon.hostedgraphite.com', 2003
conn.puts apikey + ".request.time 1444\n"
conn.close
UDP Connection
require 'socket'

apikey = ENV['HOSTEDGRAPHITE_APIKEY']
sock   = UDPSocket.new
sock.send apikey + ".request.time 1444\n", 0, "carbon.hostedgraphite.com", 2003
Using with Python
TCP Connection
import socket
import os

apikey = os.environ['HOSTEDGRAPHITE_APIKEY']
conn   = socket.create_connection(("carbon.hostedgraphite.com", 2003))
conn.send("%s.request.time 1444\n" % apikey)
conn.close()
UDP Connection
import socket
import os

apikey = os.environ['HOSTEDGRAPHITE_APIKEY']
sock = socket.socket(socket.AF_INET, socket.SOCK_DGRAM)
sock.sendto("%s.request.time 1444\n" % apikey, ("carbon.hostedgraphite.com", 2003))
Using with PHP
TCP Connection
<?
$apikey = getenv('HOSTEDGRAPHITE_APIKEY');
$conn   = fsockopen("carbon.hostedgraphite.com", 2003);
fwrite($conn, $apikey . ".request.time 1444\n");
fclose($conn);
?>
UDP Connection
<?
$apikey  = getenv('HOSTEDGRAPHITE_APIKEY');
$sock    = socket_create(AF_INET, SOCK_DGRAM, SOL_UDP);
$message = $apikey . ".request.time 1444\n";
socket_sendto($sock, $message, strlen($message), 0, "carbon.hostedgraphite.com", 2003);
?>
Using with Java
TCP Connection
String apikey = System.getenv("HOSTEDGRAPHITE_APIKEY");
Socket conn   = new Socket("carbon.hostedgraphite.com", 2003);
DataOutputStream dos = new DataOutputStream(conn.getOutputStream());
dos.writeBytes(apikey + ".request.time 1444\n");
conn.close();
UDP Connection
String apikey         = System.getenv("HOSTEDGRAPHITE_APIKEY");
DatagramSocket sock   = new DatagramSocket();
InetAddress addr      = InetAddress.getByName("carbon.hostedgraphite.com");
byte[] message        = apikey + ".request.time 1444\n".getBytes()
DatagramPacket packet = new DatagramPacket(message, message.length, addr, 2003);
sock.send(packet);
sock.close();
Using with Node.js
TCP Connection
var net    = require('net');
var apikey = process.env.HOSTEDGRAPHITE_APIKEY;

var socket = net.createConnection(2003, "carbon.hostedgraphite.com", function() {
   socket.write(apikey + ".request.time 1444\n');
   socket.end();
});
UDP Connection
var dgram  = require('dgram');
var apikey = process.env.HOSTEDGRAPHITE_APIKEY;

var message = new Buffer(apikey + ".request.time 1444\n");
var client = dgram.createSocket("udp4");
client.send(message, 0, message.length, 2003, "carbon.hostedgraphite.com", function(err, bytes) {
    client.close();
});
Troubleshooting
Reference the Hosted Graphite Heroku docs for more details and troubleshooting steps. If the docs are unable to provide the answers you need, you can reach out to Hosted Graphite support through the in-app chat feature.
Migrating between plans
Application owners should carefully manage the migration timing to ensure proper application function during the migration process.
Use the ‘heroku addons:upgrade’ command to migrate to a new plan.
$ heroku addons:upgrade hostedgraphite:newplan -a <app-name>
-----> Upgrading hostedgraphite:newplan to sharp-mountain-4005... done, v18 ($49/mo)
       Your plan has been updated to: hostedgraphite:newplan
Removing the add-on
Hosted Graphite can be removed via the CLI.
This will destroy all associated data and cannot be undone!
$ heroku addons:destroy hostedgraphite -a <app-name>
-----> Removing hostedgraphite from sharp-mountain-4005... done, v20 (free)
Support
Hosted Graphite support can be submitted via one of the Heroku Support channels. You can also contact the Hosted Graphite team directly by starting a new conversation through the in-app chat feature. Any non-support related issues or product feedback is welcome - just email us at sales@hostedgraphite.com.
Additional resources
Additional resources and information are available at: