Table of Contents [expand]
- Compatibility and requirements
- Provisioning the add-on
- Attaching the add-on to multiple applications
- Attaching the add-on to multiple app environments
- Disabling monitoring
- Library functionality
- Dashboard
- Identifying memory bloat
- N+1
- Deploy Tracking
- Log Management Addon
- Database Monitoring Addon
- Advanced configuration
- Review/CI apps
- Troubleshooting
- Removing the add-on
- Billing
- Support
Last updated December 16, 2024
Scout is an application performance monitoring add-on that analyzes your Ruby, Python, and Elixir app behavior, helping you identify and resolve critical performance and stability issues. With integrated log management and APM features, Scout helps you:
- Memory leaks and bloat
- Slow SQL queries and expensive N+1 logic
- Capacity issues
- Correlate logs with performance traces
- Filter and search logs using your existing APM context
In many cases, Scout is able to track problems down to a line-of-code - and if the optional Git integration is enabled - the developer and commit date.
In addition to deep transaction analysis, Scout automatically tracks key performance indicators in your app, allowing you to guage your app’s health over time:
- View response times by tier (database, HTTP calls, Redis, and more) to identify problems in backend services
- Identify your most expensive controller-actions
- CPU and memory usage of your app processes
- Centralize and analyze application logs with APM context
Scout is distributed as a Ruby gem, Python package, and Elixir Hex package.
Compatibility and requirements
- Ruby: supports Ruby on Rails 2.2+ and Ruby 1.8.7+.
- Elixir: Phoenix 1.2+ and Elixir 1.3+.
- Python: Django 1.8+ and Python 2.7 and 3.4+.
Provisioning the add-on
Scout can be attached to a Heroku application via the CLI:
$ heroku addons:create scout
-----> Adding scout to sharp-mountain-4005... done, v18 (free)
Once Scout has been added a SCOUT_KEY setting will be available in the app configuration and will contain the the authentication key used to report metrics to your Scout account. This can be confirmed using the heroku config:get command.
App installation
Following the add-on provisioning, one additional step is required: add Scout to your application code. Language-specific instructions are presented in the Scout add-on dashboard. You will begin seeing metrics a couple of minutes after deploying your application. You can also view instructions for your language on our help site:
Attaching the add-on to multiple applications
Scout can be attached to multiple applications, allowing you to view your apps from a single account. To attach Scout to another application:
$ heroku addons:attach scout
-----> Adding scout to sharp-mountain-4005... done, v18 (free)
Attaching the add-on to multiple app environments
Scout aggregates metrics by application name. By default, if you’ve attached the add-on to multiple environments, the metrics will be aggregated into a single application within Scout. Typically, it is beneficial to view your app metrics separated by environment. To monitor an app running in another environment:
$ heroku addons:attach scout
-----> Adding scout to sharp-mountain-4005... done, v18 (free)
Then, set a heroku config var with the name SCOUT_NAME:
heroku config:set SCOUT_NAME="YOUR_APP_NAME - YOUR_ENVIRONMENT"
Disabling monitoring
To turn off monitoring (for example, if you wish to disable monitoring for your staging environment), toggle the SCOUT_MONITOR Heroku config var:
heroku config:set SCOUT_MONITOR=false
Library functionality
Once installed, the scout_apm library will automatically trace your app’s web endpoints and background jobs. Popular libraries (ActiveRecord, Redis, Net::HTTP, etc) are automatically instrumented. scout_apm reports timing and memory allocation metrics every minute to Scoutapp.com via a background thread.
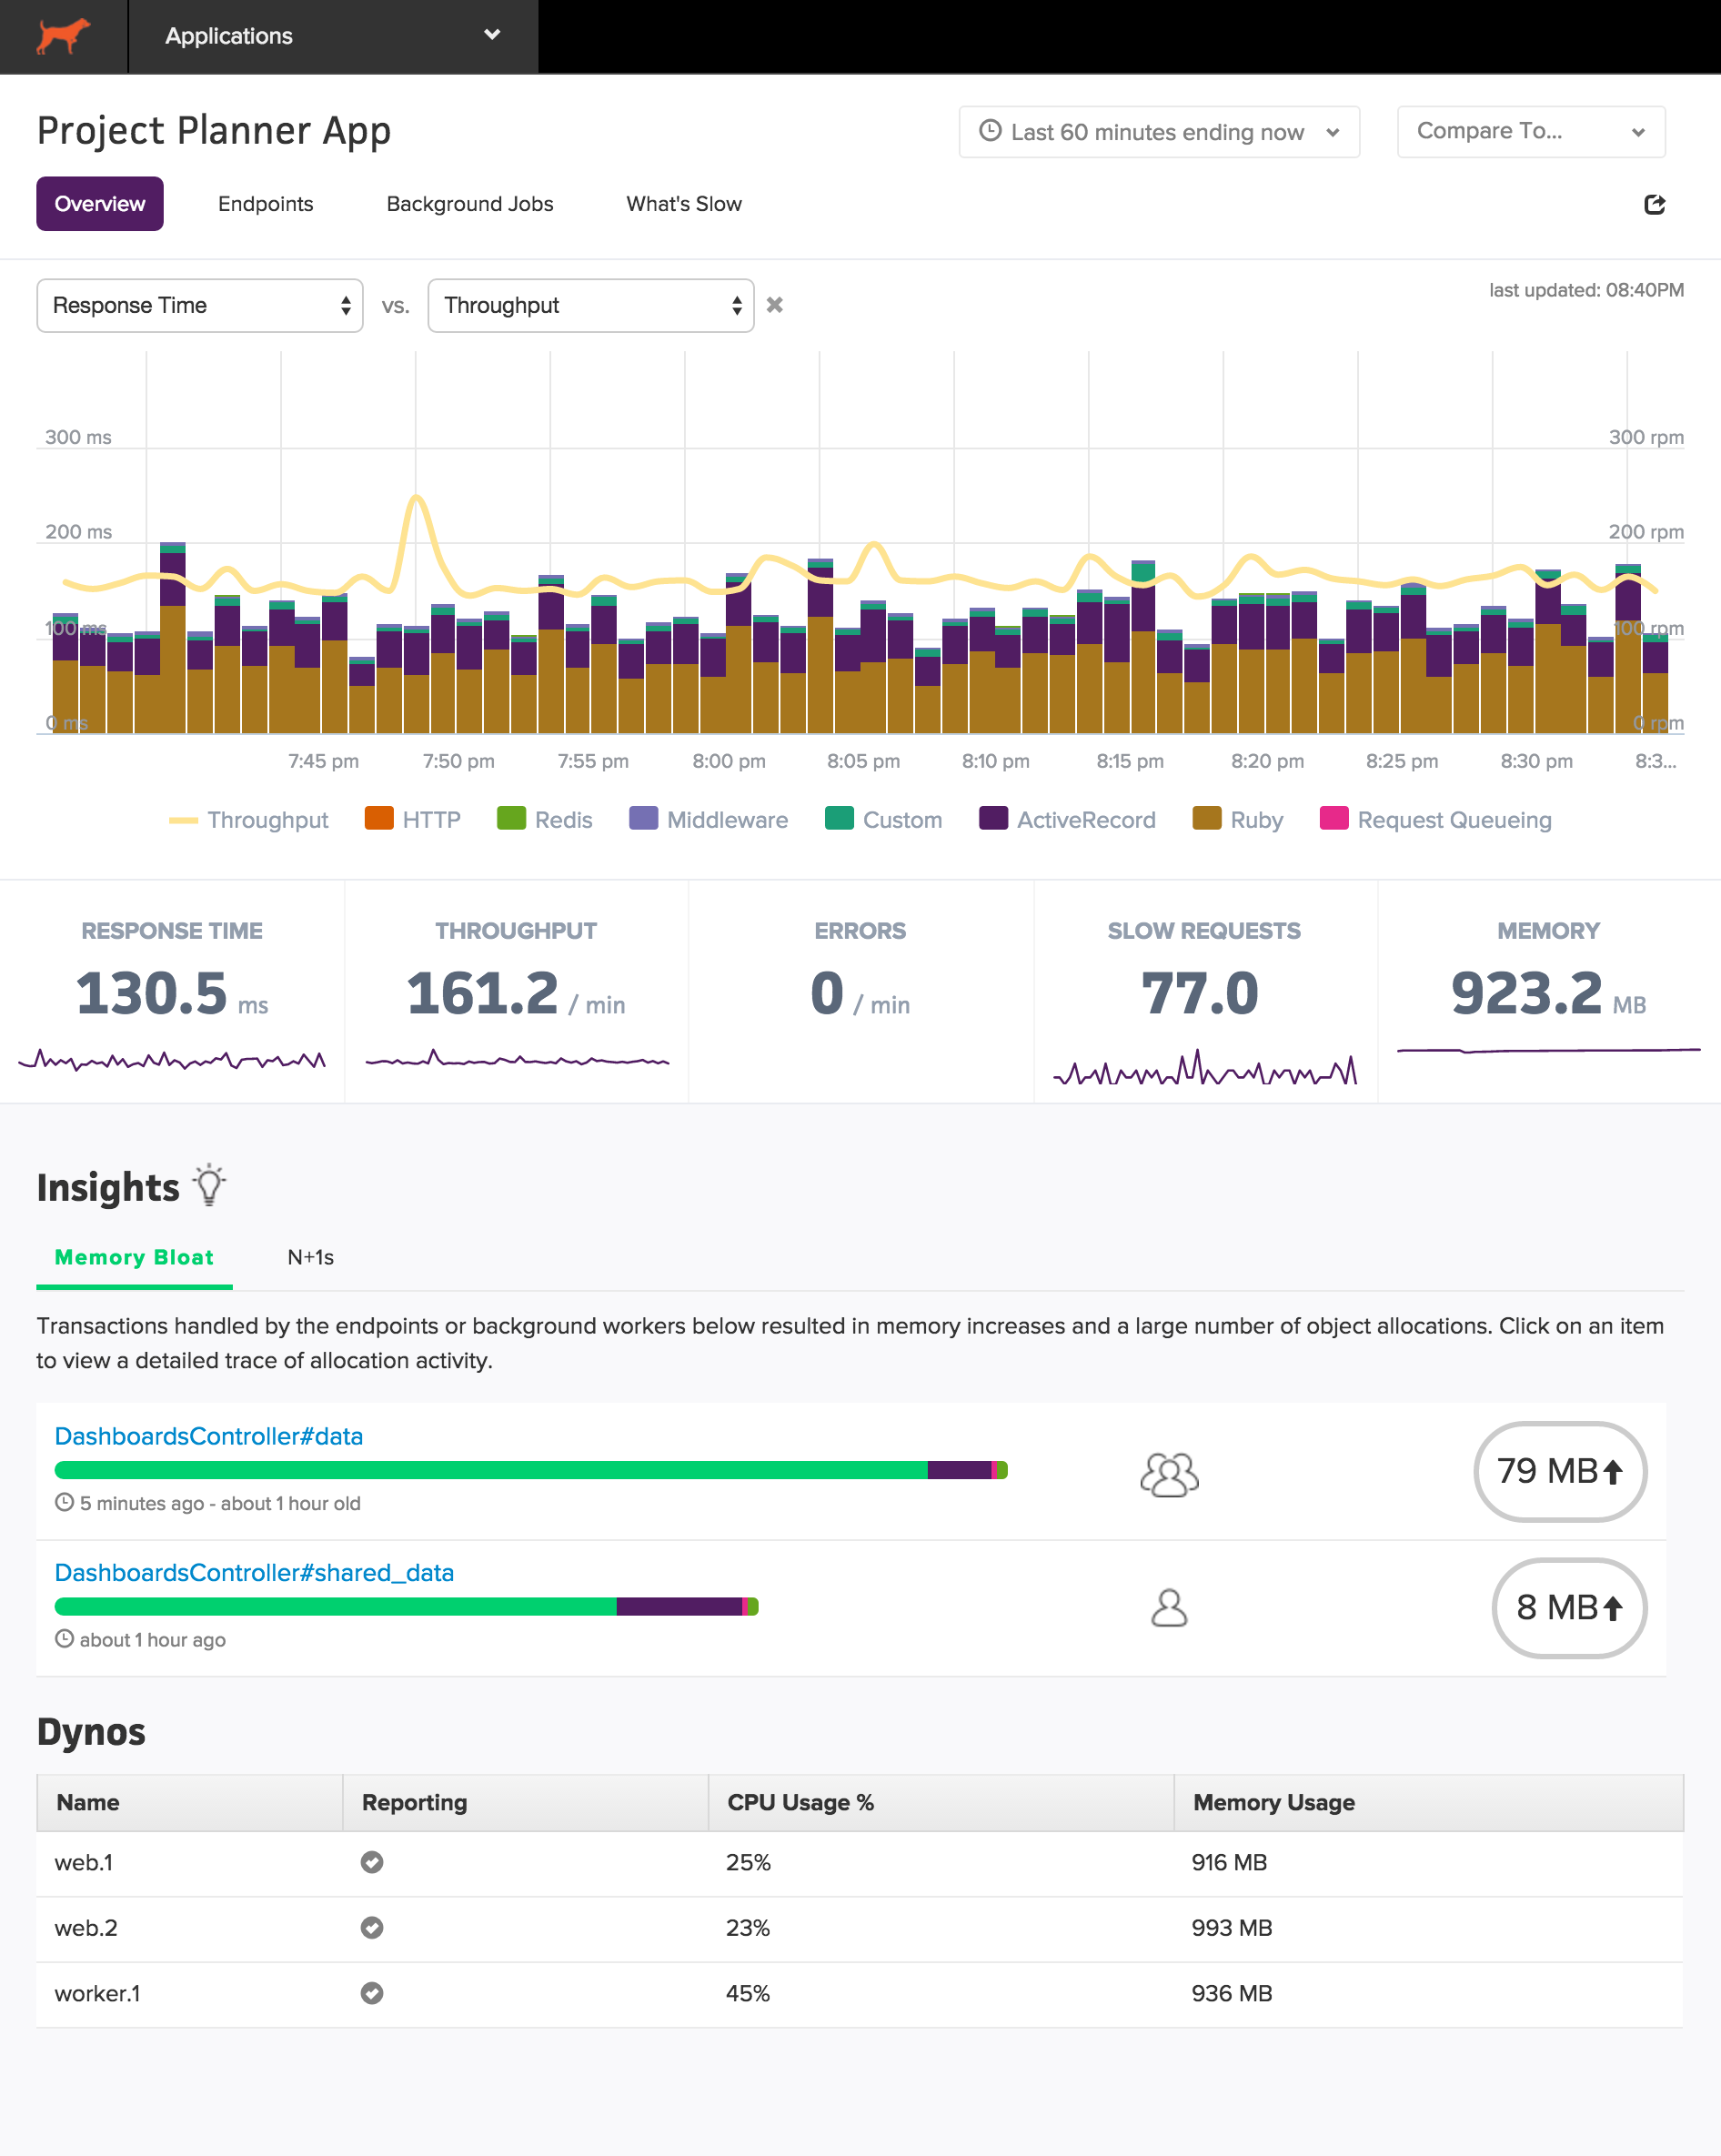
Dashboard
The Scout dashboard is the entry point to your app’s performance analytics and Scout’s performance insights.
The dashboard can be accessed via the CLI:
$ heroku addons:open scout
Opening scout for sharp-mountain-4005
or by visiting the Heroku Dashboard and selecting the application in question. Select Scout from the Add-ons menu.
The Scout dashboard is divided into two areas: Key Performance Indicators and Insights. More on those are below.
Key Performance Indicators
The top section of the dashboard displays an auto-refreshing view of key application health metrics. You can view metrics across a wide time range and compare performance to previous time periods.
Insights
Scout continually analyzes your app’s request behavior, identifying areas that may be leading to stability and performance issues. The result of this analysis is displayed on the dashboard beneath the key performance indicators.
Identifying memory bloat
If a user triggers a request to your application that results in a large number of object allocations (example: loading a large number of ActiveRecord objects), your app may require additional memory. The additional memory required to load the objects in memory is released back very slowly. Therefore, a single memory-hungry request will have a long-term impact on your app’s memory usage.
The Insights area of the dashboard identifies controller-actions and background jobs that have triggered significant memory increases. An overview of the object allocation breakdown by tier (ActiveRecord, ActionView, etc) is displayed on the dashboard.
Clicking on a memory-hungry endpoint listed in the Insights section of the dashboard reveals a detailed trace of object allocations:
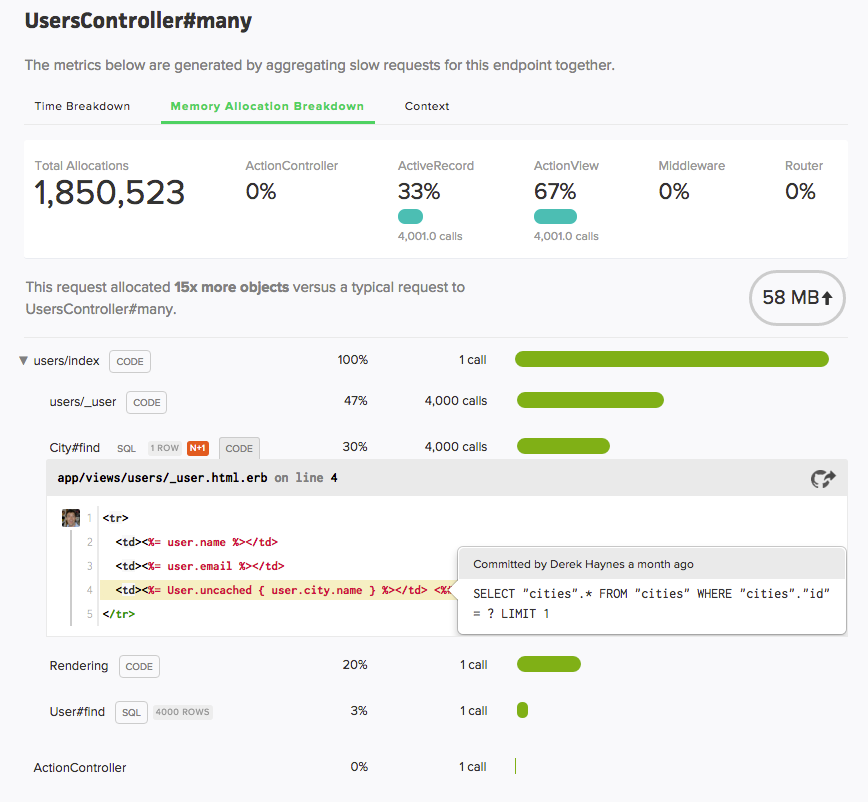
N+1
Scout analyzes traces from your application for N+1 queries consuming over 150 ms. This insight feature is included in base plans and does not require the database addon.
Deploy Tracking
Scout can track deploys, making it easier to correlate changes in your app to performance.
Enable Dyno Metadata to begin tracking deploys. This adds a HEROKU_SLUG_COMMIT environment variable to your dynos, which Scout then associates with deploys.
Log Management Addon
Scout’s log management addon provides powerful log aggregation and analysis features that integrate deeply with your existing APM data.
Currently, Log Management is only officially supported for Rails and Python applications. Please contact Scout if you are interested in using Log Management for additional languages/frameworks.
The Log Management addon provides:
- Streamlined log aggregation and analysis
- Filtering logs by APM custom context
- Automatic correlation of logs with APM traces
- Log grouping by endpoint/controller
- 14-day retention of all logs
The addon is available in four tiers:
- logs20: 20GB storage for $20/month
- logs100: 100GB storage for $50/month
- logs400: 400GB storage for $110/month
- logs1000: 1TB storage for $350/month
Logs are retained for 14 days.
Enabling Log Management
Scout does not yet use Heroku Log Drain. Instead, we attach to native loggers via easily configured packages.
For Ruby:
gem "scout-logging"
For Python:
pip install scout-apm-logging
- Add the provided Scout logging handler to your logging configuration. Examples are provided here.
Next, upgrade your plan by appending -logs20, -logs100, -logs400, or -logs1000 to your current plan name. For example, if you’re on the “eldora” plan:
heroku addons:upgrade scout:eldora-logs20 --app your-app
If you’re using both database monitoring and log management, append the logs plan after the database addon (e.g., eldora-db-logs20):
term
heroku addons:upgrade scout:eldora-db-logs20 --app your-app
Log Management Configuration
After upgrade your plan and installing the Scout logging package for your language, the last step is setting the following configuration variables:
heroku config:set SCOUT_LOGS_MONITOR=true
heroku config:set SCOUT_LOGS_INGEST_KEY=your-key-here
You can find your logs ingest key in the Logs tab of Scout APM.
More Information on Log Management
Database Monitoring Addon
By default, Scout tracks the time spent in database queries for each transaction and displays individual queries in transaction traces. For additional database insights, the database monitoring addon can be enabled.
The database addon gives you access to both a high-level overview of your database query performance and detailed information on specific queries. More information
The addon is 25% of your Heroku plan. For example, if your app’s Scout plan is $59/mo, the database monitoring addon is an additional $14.75/mo.
Scout’s database monitoring plans aren’t visible from our public listing page to remove noise. Upgrade instructions are available in the Scout UI (generally, just append “-db” to the name of your plan, so “skiloveland” becomes “skiloveland-db” to use the database monitoring addon).
heroku addons:upgrade scout:eldora-db --app your-app
Advanced configuration
Scout can be configured via Heroku config variables. View the configuration options for Scout.
Review/CI apps
Review/CI apps are not supported by default on the Scout Addon. Contact support@scoutapp.com if you’re interested in enabling review/CI apps.
Troubleshooting
By default, Scout logs with a WARN debug level. If you aren’t seeing metrics within the Scout interface, try the following:
1. Tail your Heroku logs, greping for the [Scout] prefix:
heroku logs --tail | grep [Scout]
2. Change the SCOUT_LOG_LEVEL config var to DEBUG. This will automatically restart your app:
heroku config:set SCOUT_LOG_LEVEL="DEBUG"
3. Check the output for any obvious errors. If you are stuck, send the output of the log stream to support@scoutapp.com along with the URL to your app (ie - https://apm.scoutapp.com/apps/ID).
Removing the add-on
Scout can be removed via the CLI.
This will destroy all associated data and cannot be undone!
$ heroku addons:destroy scout
-----> Removing scout from sharp-mountain-4005... done, v20 (free)
Billing
What is a “transaction”?
A transaction is a single web request or background job.
Exceeding the per-day transaction limit
If your app exceeds the per-day transaction limit for your subscription plan, transaction traces will be inaccessible for the remainder of the day. Monitoring of high-level metrics continues and trace collection resets on the following day.
Log Management Usage
Log management plans are billed based on storage volume:
- logs20: 20GB storage for $20/month
- logs100: 100GB storage for $50/month
- logs400: 400GB storage for $110/month
- logs1000: 1TB storage for $350/month
Logs are retained for 14 days.
Support
All Scout support and runtime issues should be submitted via one of the Heroku Support channels. We encourage you to send product feedback to support@scoutapp.com.