Last updated September 04, 2025
When your Node application uses more memory than is available on the Dyno, an R14 - Memory quota exceeded error message will be emitted to your application’s logs. This article is intended to help you understand your application’s memory use and give you the tools to run your application without memory errors.
What is a memory leak?
Every Node.js program allocates memory for new objects and periodically runs a garbage collector (GC) to reclaim the memory consumed by objects that aren’t used anymore. If the GC cannot deallocate memory, the amount of RAM taken up by your application will grow over time.
Why are memory leaks a problem?
Memory leaks become a problem when they grow large enough to slow your application down. For example, a small leak on each request can quickly become a problem when your application receives a sudden influx of traffic. Once your application exhausts all available RAM, it begins using the slower swap file, which will in turn slow down your server. Very large memory use might even crash the Node process, leading to dropped requests and downtime.
If a memory leak is small and only happens on a rarely used code path, then it’s often not worth the effort of tracking down. A small amount of extra memory builds up which gets reset every time your application is restarted, but it doesn’t slow down your application or impact users.
Heroku memory limits
The amount of physical memory available to your application depends on your dyno type. Memory use over these limits writes to disk at much slower speeds than direct RAM access. You will see R14 errors in your application logs when this paging starts to happen.
Tuning the Garbage Collector
In Node < 12, it sets a limit of 1.5 GB for long-lived objects by default. If this exceeds the memory available to your dyno, Node could allow your application to start paging memory to disk.
Gain more control over your application’s garbage collector with flags to the underlying V8 JavaScript engine in your Procfile:
web: node --optimize_for_size --max_old_space_size=920 server.js
If you’d like to tailor Node to a 512 MB dyno, try:
web: node --optimize_for_size --max_old_space_size=460 server.js
Versions of Node that are >= 12 may not need to use the --optimize_for_size and --max_old_space_size flags because JavaScript heap limit will be based on available memory.
Running multiple processes
If you are clustering your app to take advantage of extra compute resources, then you can run into a problem where the different Node processes compete with each other for your Dyno’s memory.
A common mistake is to determine the number of Node processes to run based on the number of CPUs, but the number of physical CPUs is not the best mechanism for scaling within a virtualized Linux container. The total amount of memory used by all Node processes should remain within dyno memory limits.
// Don't do this
const CPUS = os.cpus().length;
for (let i = 0; i < CPUS; i++) {
  cluster.fork();
}
To determine the appropriate number of processes to run, we recommend setting the WEB_MEMORY environment variable to the amount of memory your application requires in megabytes. If your application runs best with a gigabyte of RAM then you can set it with the following command in your application directory.
$ heroku config:set WEB_MEMORY=1024
Based on the value of WEB_MEMORY and the dyno type, we calculate an appropriate number of processes and provide a WEB_CONCURRENCY environment variable that you can use to spin up workers without exceeding the dyno’s memory limits.
const WORKERS = process.env.WEB_CONCURRENCY || 1;
for (let i = 0; i < WORKERS; i++) {
  cluster.fork();
}
Learn more about Optimizing Node.js Application Concurrency
Debugging a memory leak
When facing a memory leak there are a number of steps you should take to attempt to find the problem.
Review recent changes
If your application suddenly exhibits large spikes in memory usage without similar spikes in throughput, a bug has likely been introduced in a recent code change. Try to narrow down when this might have happened and review the changes to your application during that time.
Update your dependencies
In modern applications, your code is often the tip of an iceberg. Even a small application could have thousands of lines of JavaScript hidden in node_modules, not to mention the millions of lines of code that make up the V8 JavaScript engine and all of the native libraries on which your application is built. It is a good idea to make sure that your memory issue is not lurking in one of your dependencies by updating to the latest stable versions and checking whether that resolves the issue.
- Update to the latest version of Node.
- Check which of your Node dependencies have updates available by running
npm outdatedoryarn outdatedin your application’s directory. - Make sure your application is running on the latest Heroku stack, and if not, upgrade to the latest stack to use the latest stable version of Ubuntu with more recent system libraries.
Inspect the environment
Even if your application hasn’t changed, something in its dependency tree might have if you have not locked them down to exact versions using yarn or an npm lockfile. We also recommend explicitly specifying which version of Node that your application depends on.
A practical example
If you check all of the above and your application’s memory consumption continues to grow without limit, then it’s likely that there is a memory leak to find. Let’s take a look at an example.
A typical memory leak might retain a reference to an object that’s expected to only last during one request cycle by accidentally storing a reference to it in a global object that cannot be garbage collected. This example generates a random object using the dummy-json module to imitate an application object that might be returned from an API query and purposefully “leaks” it by storing it in a global array.
const http = require('http');
const dummyjson = require('dummy-json');

const leaks = [];

function leakyServer(req, res) {
  const response = dummyjson.parse(`
    {
      "id": {{int 1000 9999}},
      "name": "{{firstName}} {{lastName}}",
      "work": "{{company}}",
      "email": "{{email}}"
    }
  `);
  leaks.push(JSON.parse(response));
  res.end(response);
}

const server = http.createServer(leakyServer)
  .listen(process.env.PORT || 3000);
Inspecting locally
If you can reproduce the leak while running your application locally, it’s simpler to get access to useful runtime information and will be easier to track down the error.
If you are running Node >= 7.5.0, start your server by passing the –inspect flag and open the the provided URL in Chrome to open up the Chrome DevTools for your Node process.
If you are unfamiliar with the Chrome DevTools, Addy Osmani has a guide to using them to hunt down memory issues.
$ node --inspect index.js
Debugger listening on port 9229.
Warning: This is an experimental feature and could change at any time.
To start debugging, open the following URL in Chrome:
    chrome-devtools://devtools/bundled/inspector.html?experiments=true&v8only=true&ws=127.0.0.1:9229/dfd0036a-d3bd-4321-9e4b-f8e5ff70287a
If you are using Node < 7.5.0, then you can get access to the same functionality via node-inspector.
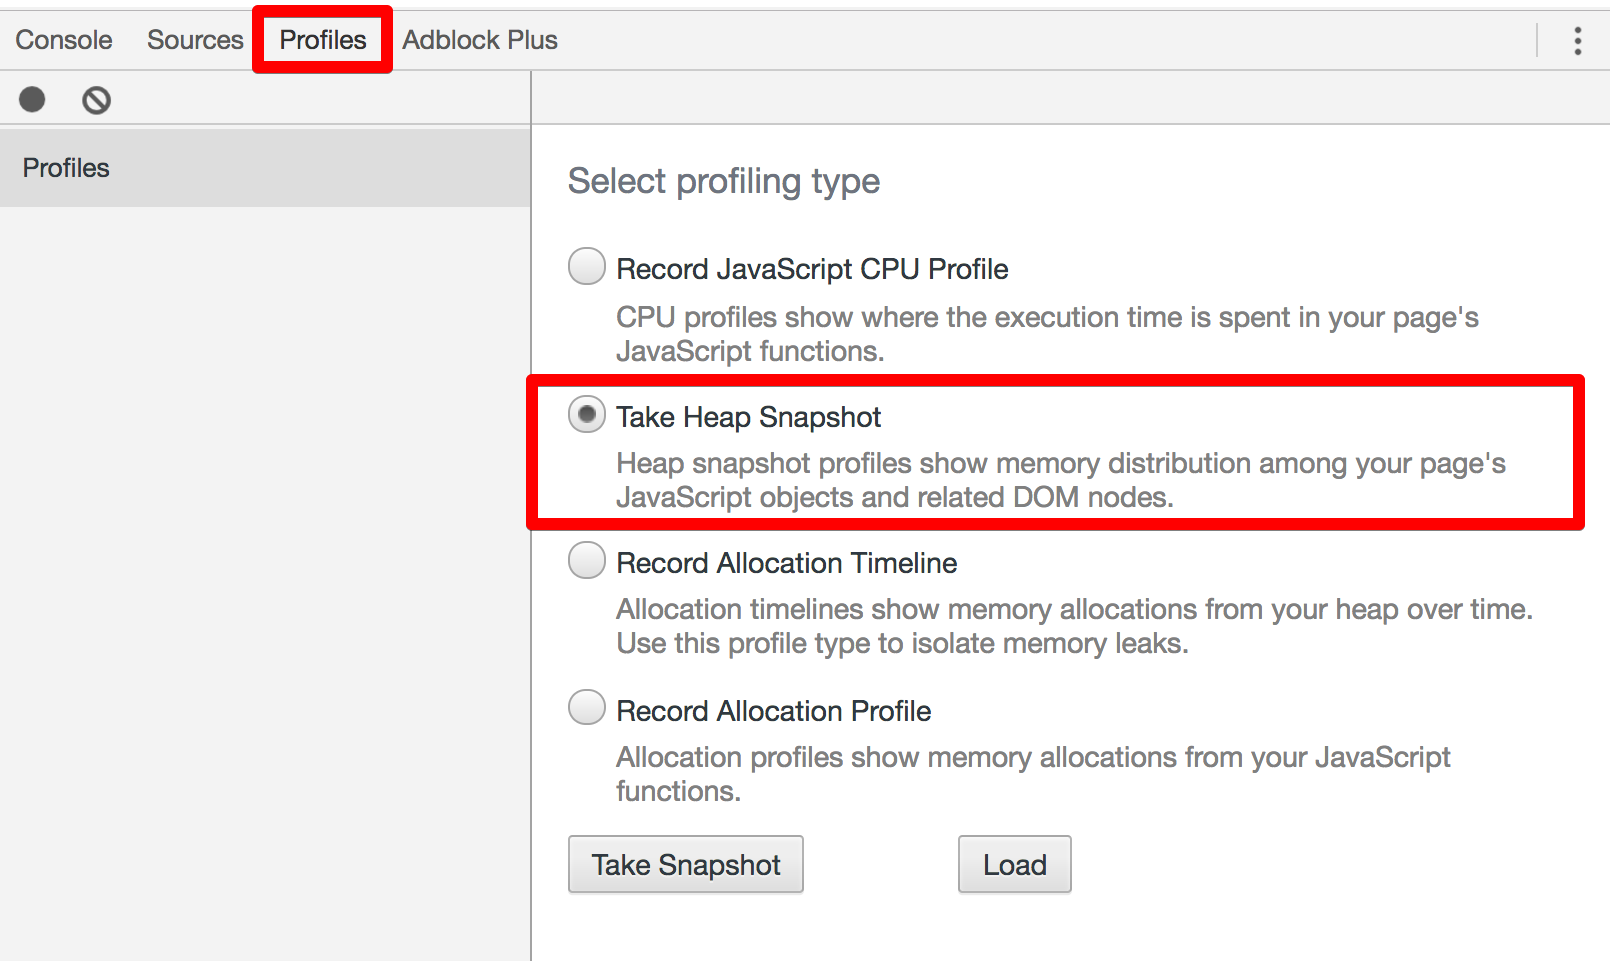
The tool you need is under the Profiles tab. Select Take Heap Snapshot and press the Take Snapshot button.

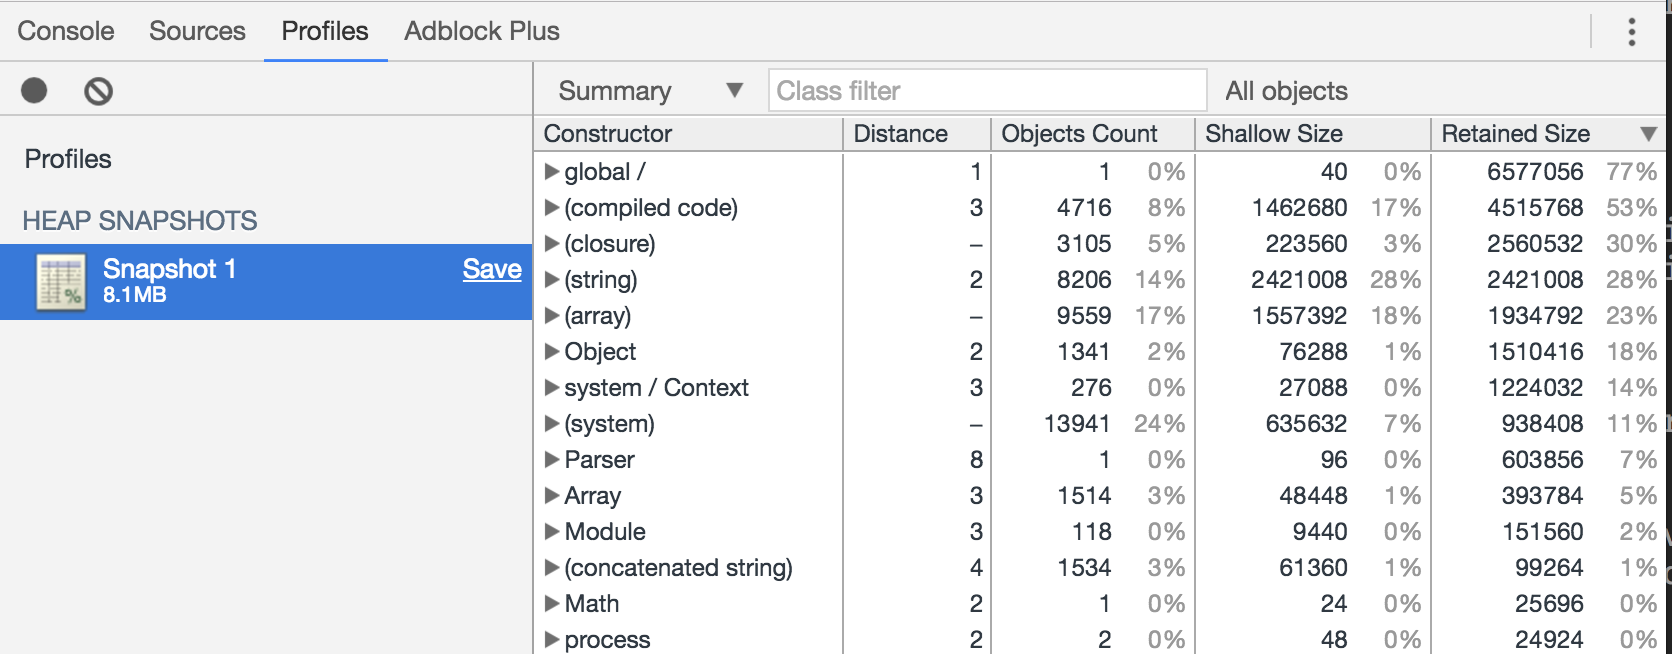
If you look at the captured snapshot you can see every data structure that has been allocated in your Node process, but it’s a bit overwhelming. To make it easier to see what’s leaking, gather some more snapshots so that you can compare them with each other.

However you will only be able to observe the leak if there is traffic being sent to the server. Run this cURL command to quickly make a large number of requests to build up some leaked objects.
$ for i in {1..1000}; do curl -s http://localhost:3000 > /dev/null; done
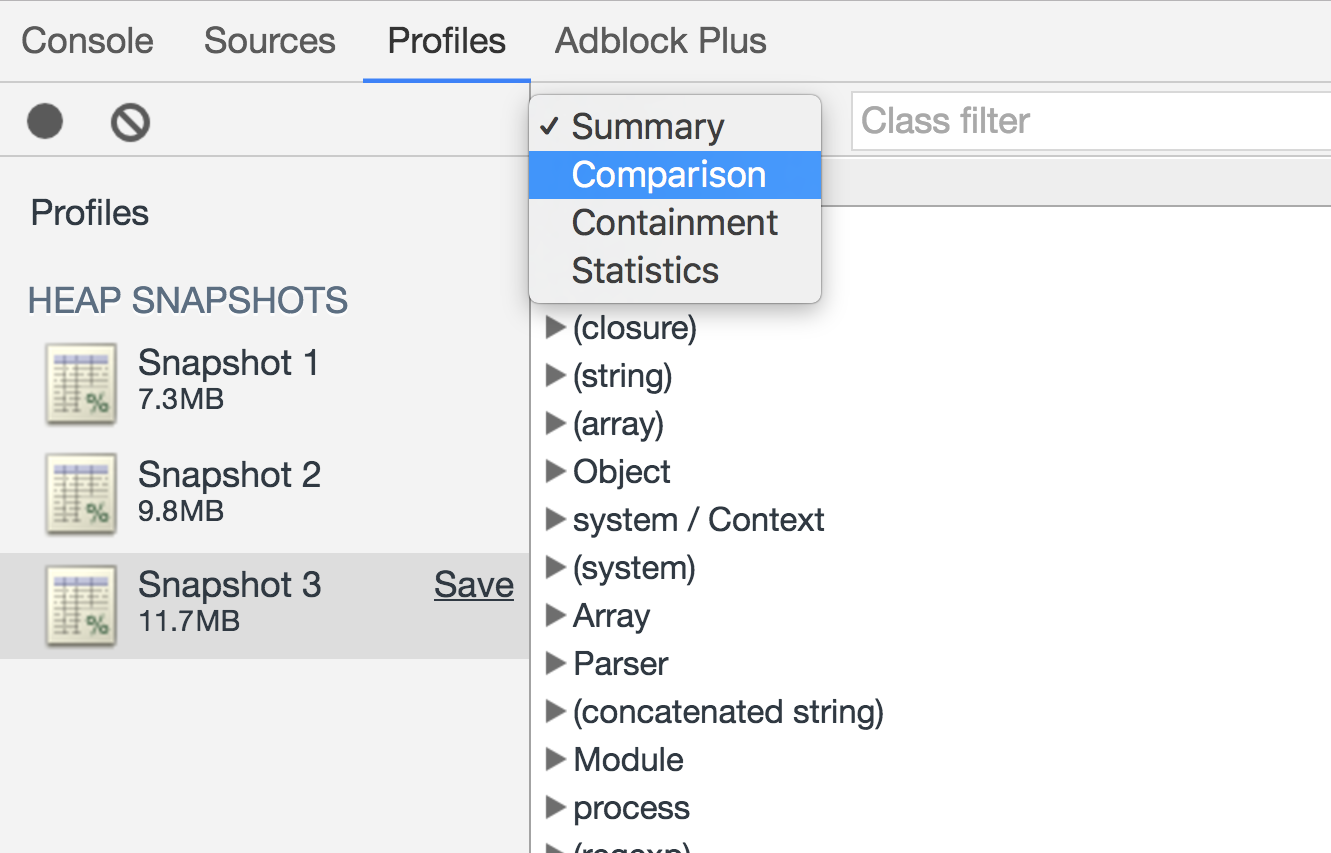
After running the command, capture another heap snapshot. Repeat this cycle a couple of times to get multiple snapshots. Then select the last snapshot and switch from the “Summary” view to the “Comparison” view in the drop down.

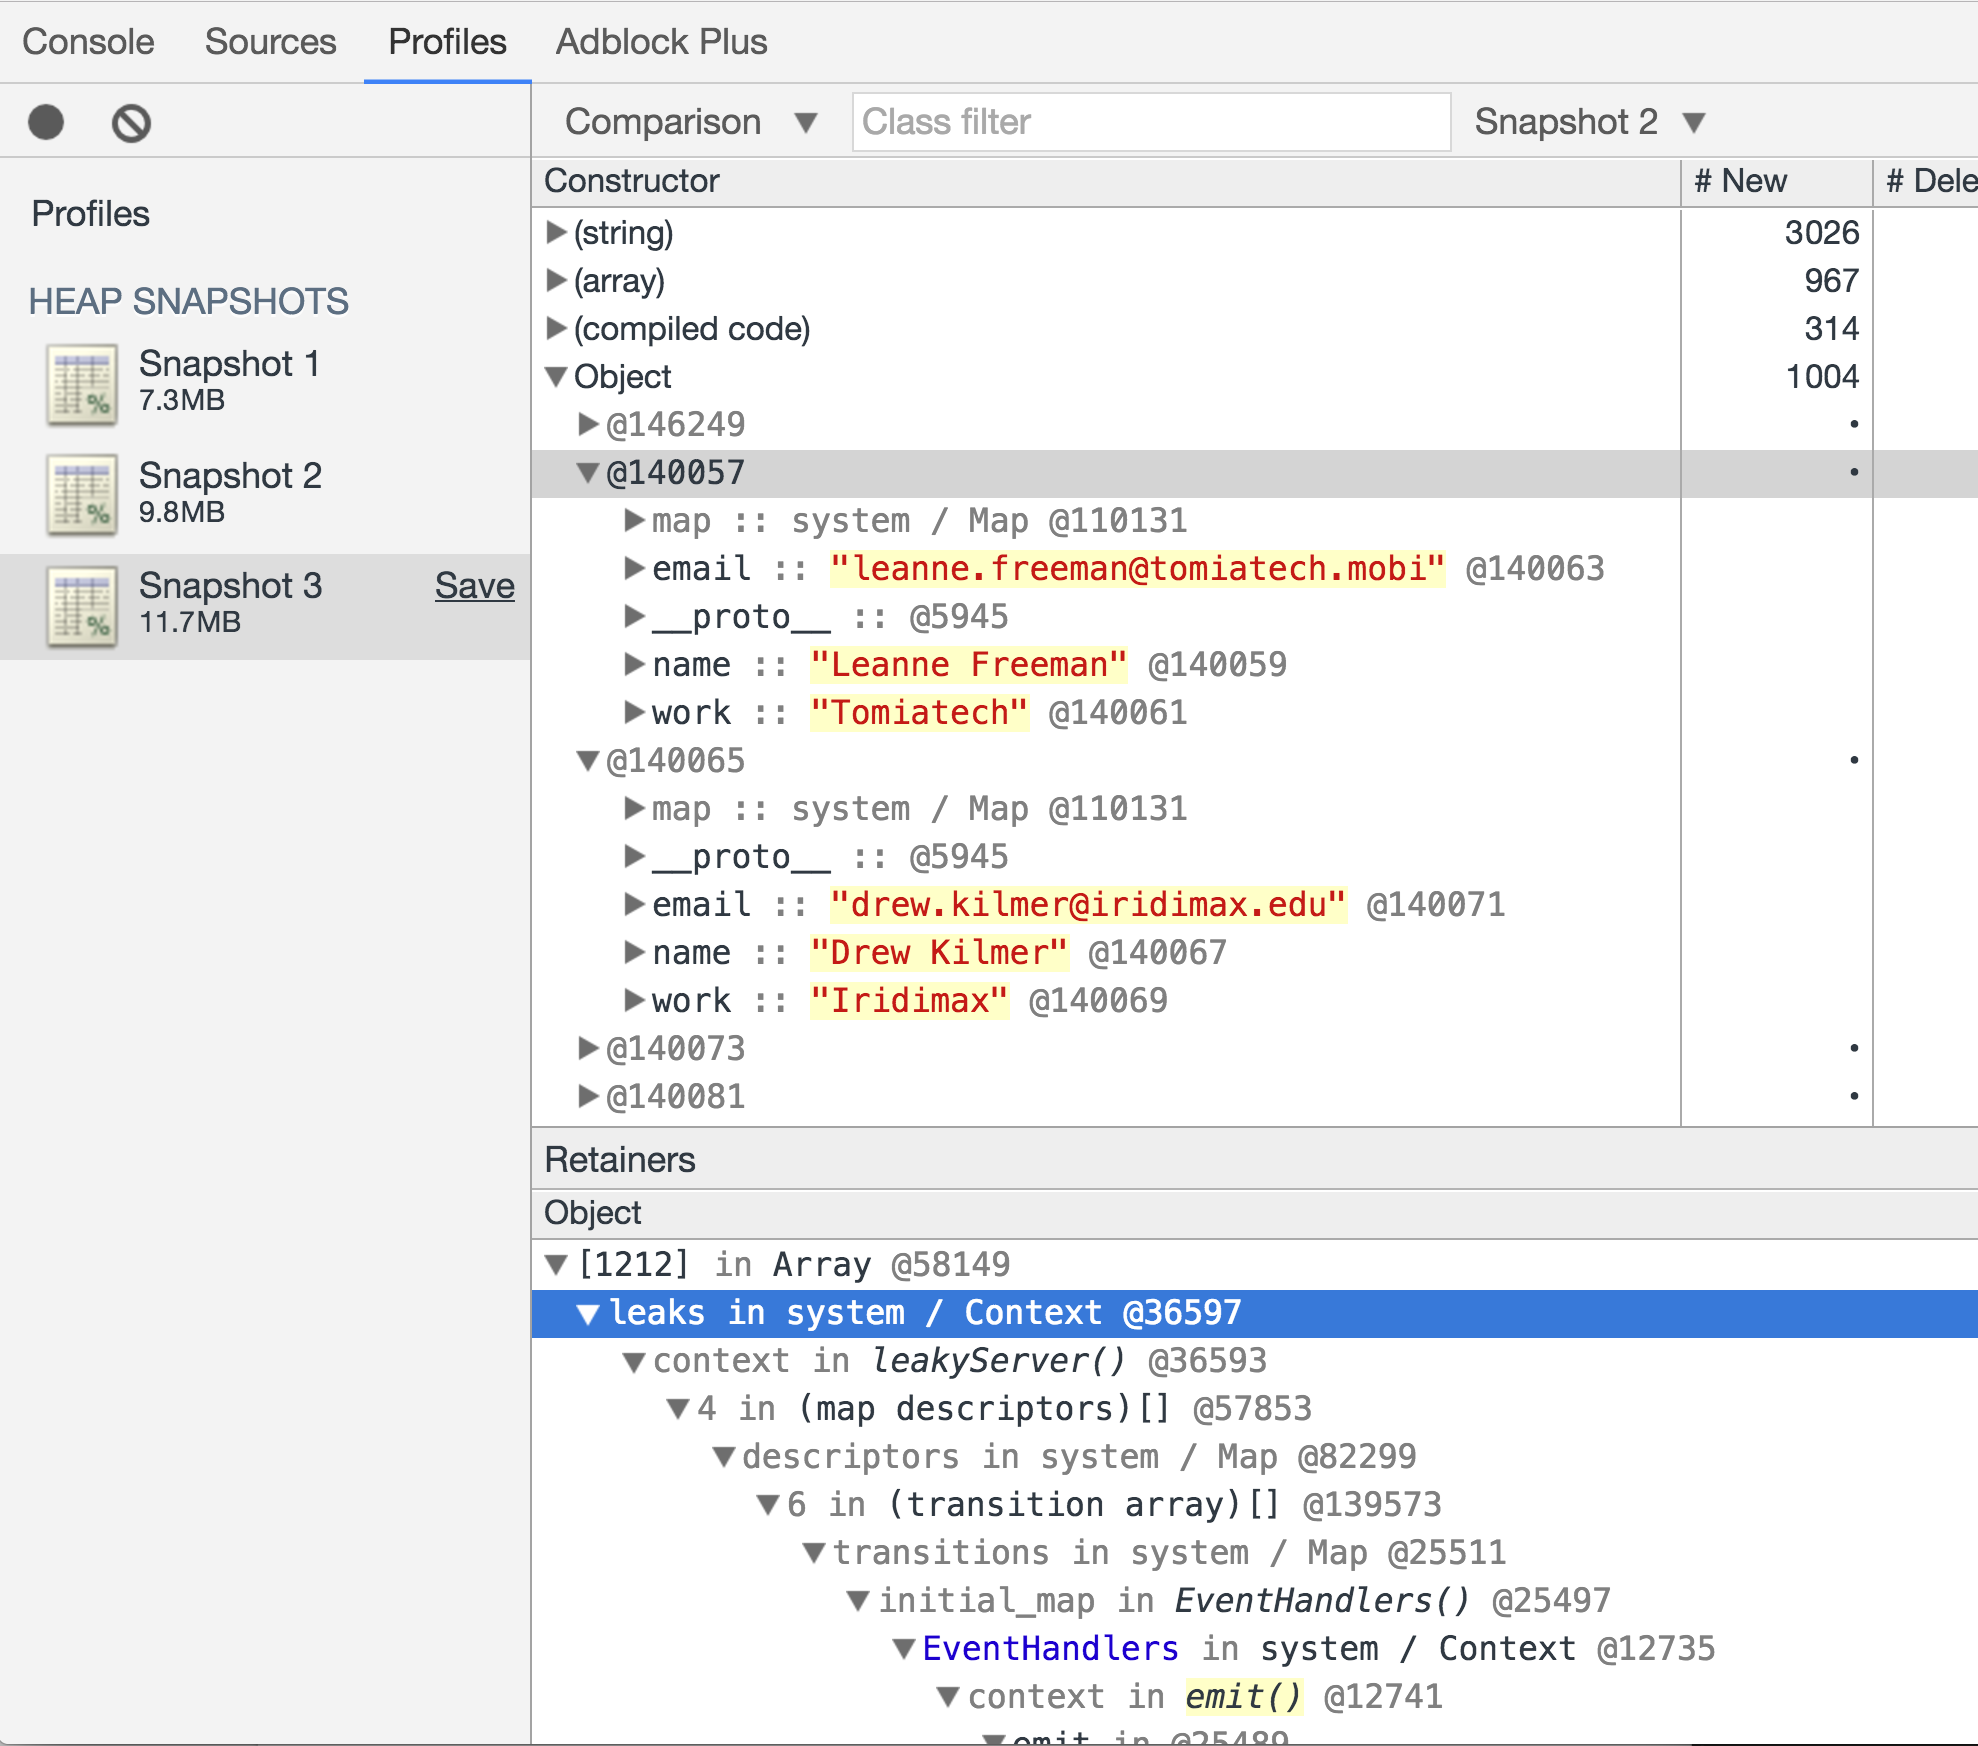
This will substantially cut down on the number of objects that you see. A good rule of thumb is to first ignore the items wrapped in parenthesis as those are built-in structures. The next item in the list in this case is Object. Looking at a couple of the retained Object’s you can see some examples of the data that has been leaked, which you can use to track down the leak in your application.

Inspecting remotely
Similar to using Chrome DevTools, you can set up port forwarding to inspect memory usage in a Heroku dyno with Heroku Exec.
It’s recommended to debug using a staging environment because Heroku Exec will connect to running dynos, so you may disrupt production traffic.
If your start script is in the package.json, add the --inspect flag to it. (The default port is 9229. In order to customize the port, you can assign a port number, such as --inspect=8080.) The package.json‘s script will look something like this:
"scripts": {
  "start": "node --inspect=8080 index.js"
}
If you’re using a Procfile, you can add the flag to your web process:
web: node --inspect=8080 index.js
Deploy these changes to Heroku. Next, set up port forwarding from a local port. Make sure use the port that is specified in the Node process.
$ heroku ps:forward 8080
You should see the following:
SOCKSv5 proxy server started on port 1080
Listening on 8080 and forwarding to web.1:8080
Use CTRL+C to stop port fowarding
You can now use Chrome DevTools to take a snapshot of memory usage in your web process.