Table of Contents [expand]
Last updated December 09, 2024
The JVM Runtime Metrics feature allows you to view heap and non-heap memory, as well as garbage collection activity, for any app that runs inside of the Java Virtual Machine (JVM). This includes (but is not limited to) apps written in Java, Clojure, Gradle, Lein, Maven, Scala, and JRuby,
JVM Runtime Metrics are available for all dynos except for eco dynos.
General Information
For general information on language specific metrics, please refer to the language runtime metrics parent document.
Getting Started
Once you have enabled the Enhanced Language Metrics feature (by following these instructions), re-deploy your application using an empty commit.
$ git commit --allow-empty -m "Enable Heroku Metrics"
$ git push heroku master
Afterwards, your application should begin exporting memory metrics for the JVM.
Available Metrics
It may take a few minutes for these metrics to become available after the steps above are completed.
Heap Memory Usage
This chart plots, in megabytes (MB) the overall memory quota and the maximum heap memory usage across all dynos in the currently selected process type. Summary metrics for the selected time interval, including latest, average and maximum memory, are also displayed.
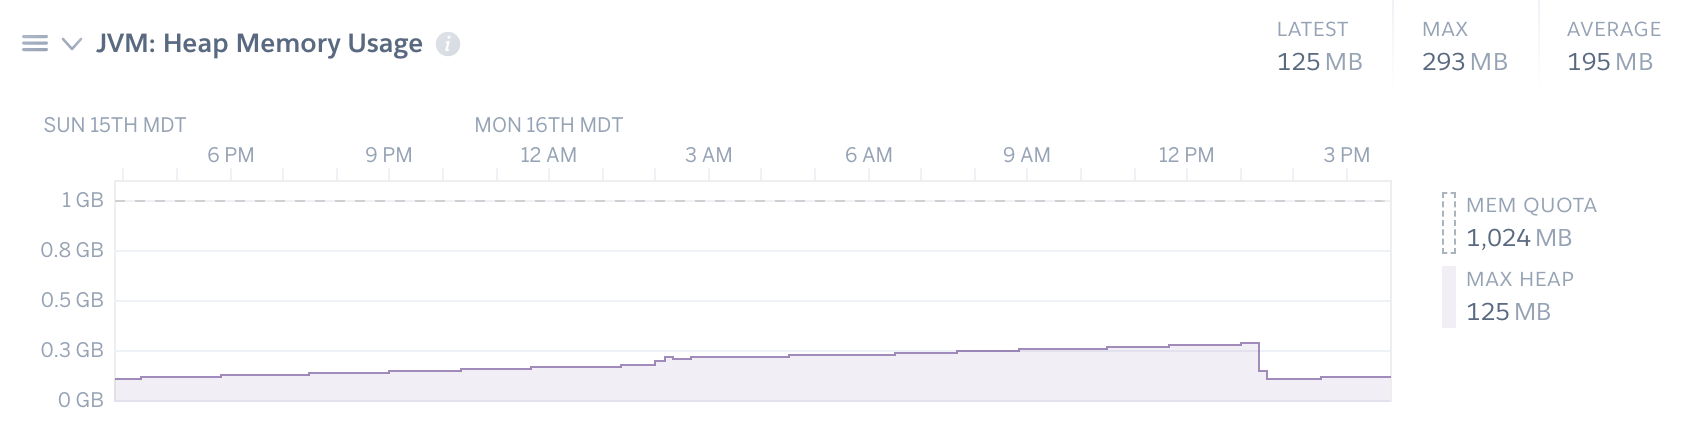
How to use this chart
Heap memory is where dynamically allocated memory resides. If you see heap memory growing unexpectedly, that’s typically an indication of a memory leak. You can use tools like Heroku Java CLI for further diagnosis.
Non-Heap Memory Usage
This chart plots, in megabytes (MB) the overall memory quota (note: the memory quota time series is toggled off in this screenshot), the maximum non-heap memory usage, the maximum buffer pool direct memory usage, and the maximum buffer pool mapped memory usage, across all dynos in the currently selected process type. Summary metrics for the selected time interval, including latest, average and maximum memory, are also displayed.
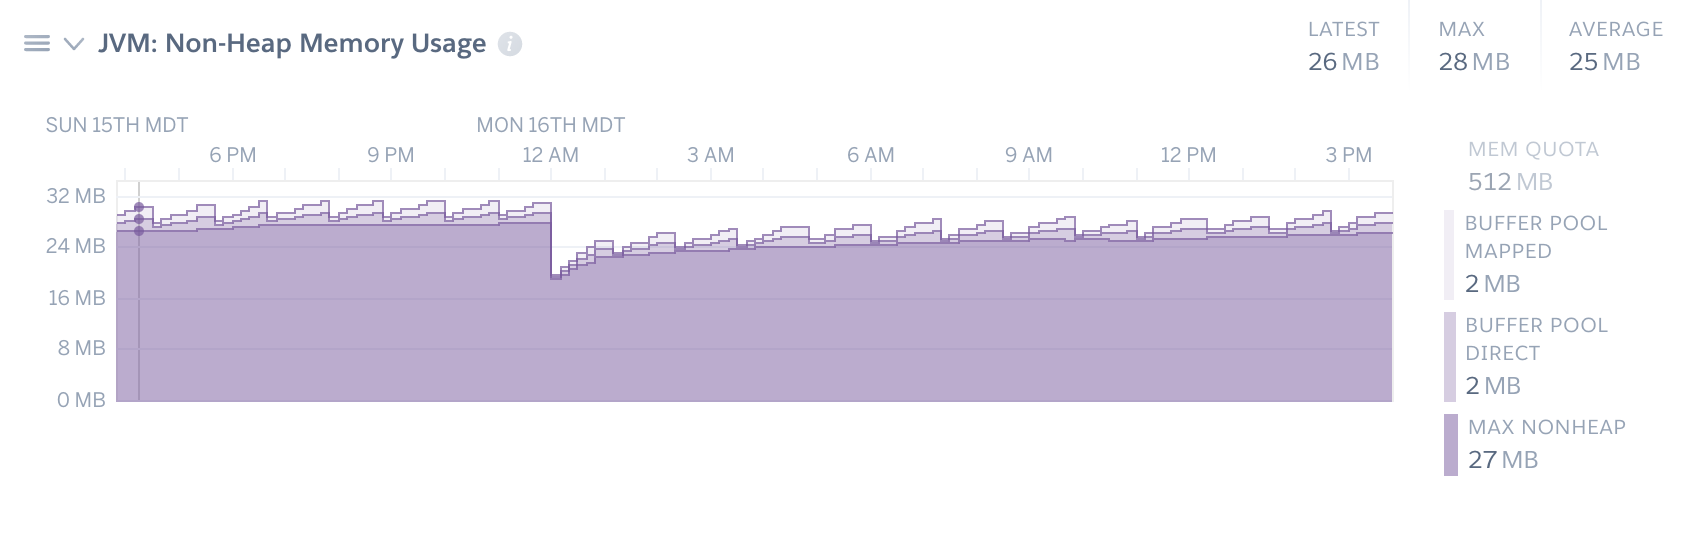
The buffer pool mapped and direct time series will only show up if you have any memory usage of those types during the selected timeframe.
How to Use This Chart
The non-heap memory usage chart can be used to identify memory leaks or excessive consumption of Metaspace and buffer pools. For more information on debugging these kinds of problems, see the article on Troubleshooting Memory Issues in Java Applications.
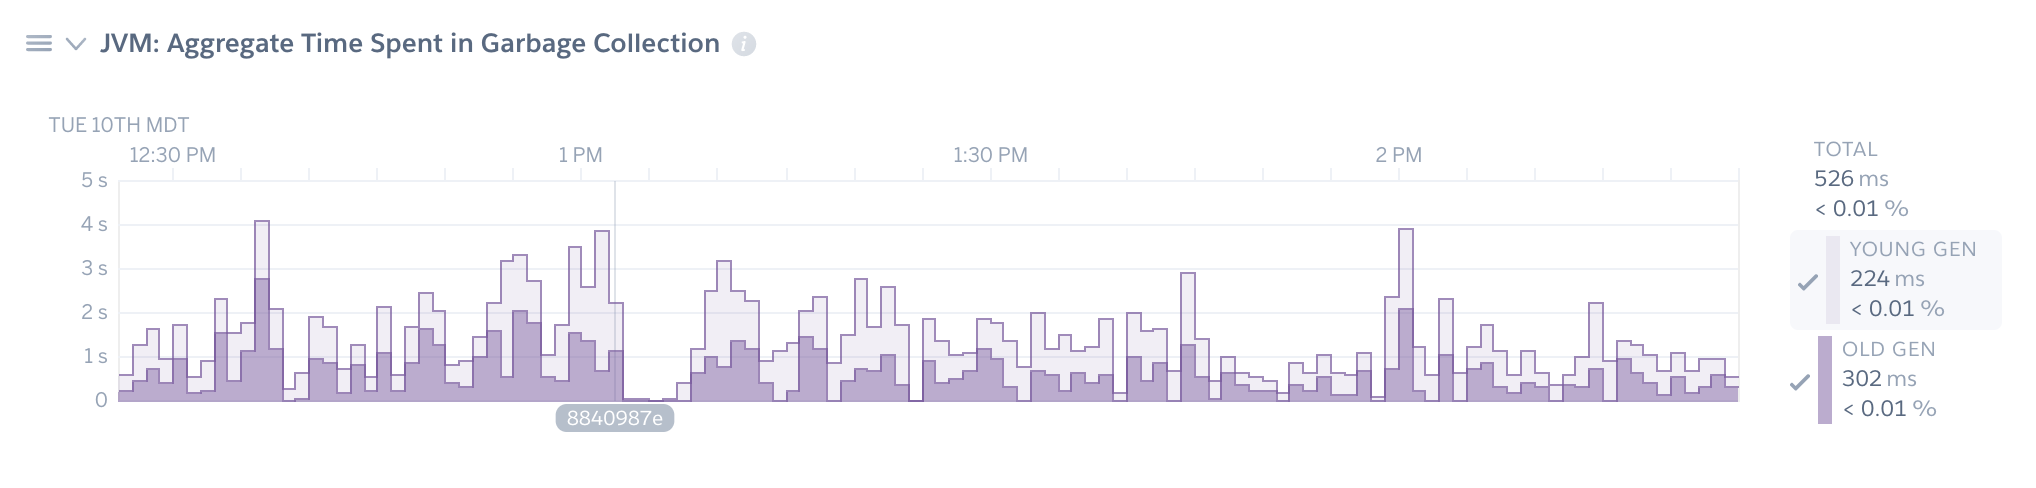
Aggregate Time Spent in Garbage Collection
This chart plots the aggregate amount of time that was spent doing garbage collection during each roll up, broken down by Young and Old generations. In the legend, you will see a breakdown of the percentage of time during the roll up was spent running the garbage collector.
Aggregate Garbage Collections
This chart plots the aggregate number of times that the garbage collector ran during each roll up, broken down by Young and Old generations.
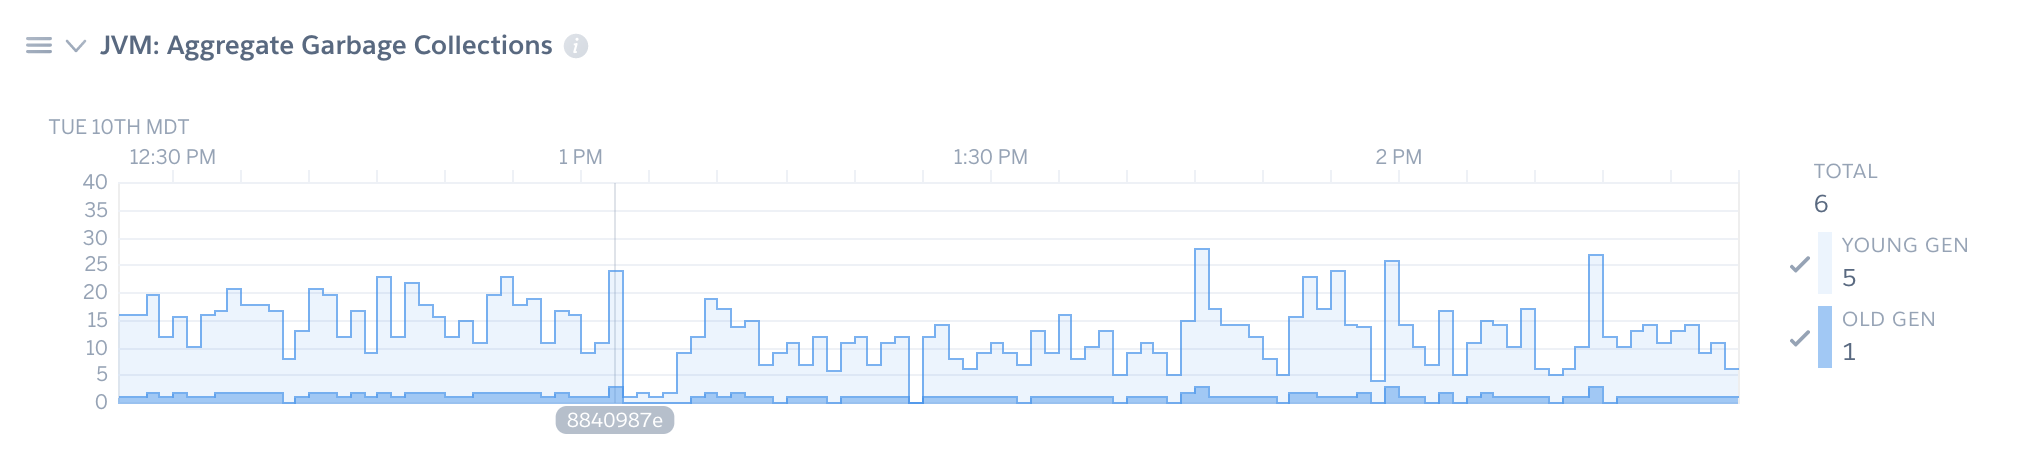
How to Use These Charts
The garbage collection charts can be used to tune both the GC and the heap. Like many performance issues, choosing a heap size is a matter of balance. If the heap is too small, the program will spend too much time performance GC. But a very large heap will increase the duration of those pauses. A good rule of thumb is to size the heap so that it is 30% occupied after a full GC, as indicated by the GC chart.
Performance implications
Language runtime metrics collects data from the JVM running on your dyno. The overall impact of JVM metrics collection on application performance is minimal. In our testing we observed the following:
- an estimated 1MB of additional peak heap usage
- ~200 additional classes loaded, resulting in < 1MB of additional Metaspace (off-heap) memory
- 1 additional thread
Using with JRuby
To use this feature with JRuby, you must include the heroku/jvm buildpack with your app by running:
$ heroku buildpacks:add -i 1 heroku/jvm
Then redeploy your application.
Disabling Metrics Collection
To disable JVM metrics collection, simply toggle off the Enhanced Language Metrics toggle via the Metrics Preferences panel, or using this CLI command:
$ heroku labs:disable "runtime-heroku-metrics" -a "my-app-name"